A Policy, Economic, and Legal Analysis: Bottom-Up Cost Modelling of 206 Routes Across All G20 Nations
Abstract
Air travel has become structurally necessary for modern life. Economic migration, global family ties, remote work, and the internationalisation of commerce have made the ability to reach any city in the world a functional prerequisite for participation in the global economy, not a luxury reserved for the affluent. Yet the pricing mechanism that governs access to air travel has not evolved to reflect this reality. Fares on the same seat, on the same route, on the same day can differ by 600 percent depending on when they are purchased, by whom, and through which distribution channel.
This paper proposes a restructuring of commercial aviation around a single governing principle: that a standard flight should be priced the same way a subway fare is priced. The mechanism for reaching this is not nationalisation but standardisation, a globally adopted cost-reflective fixed-fare framework, grounded in transparent aircraft operating economics, that eliminates speculative pricing while preserving commercial sustainability.
We build a bottom-up cost model from first principles across 206 routes in all G20 countries, deriving economy and business class fares from actual fuel burn, aircraft ownership, crew salary, maintenance, ground handling, and a streamlined overhead structure that eliminates revenue management, GDS distribution costs, and marketing. Business class is allocated 10 percent of cabin floor area and priced at 10 times the economy fare, generating a cross-subsidy that reduces the economy fare. Eighty-five percent of belly cargo surplus revenue is redistributed to passengers.
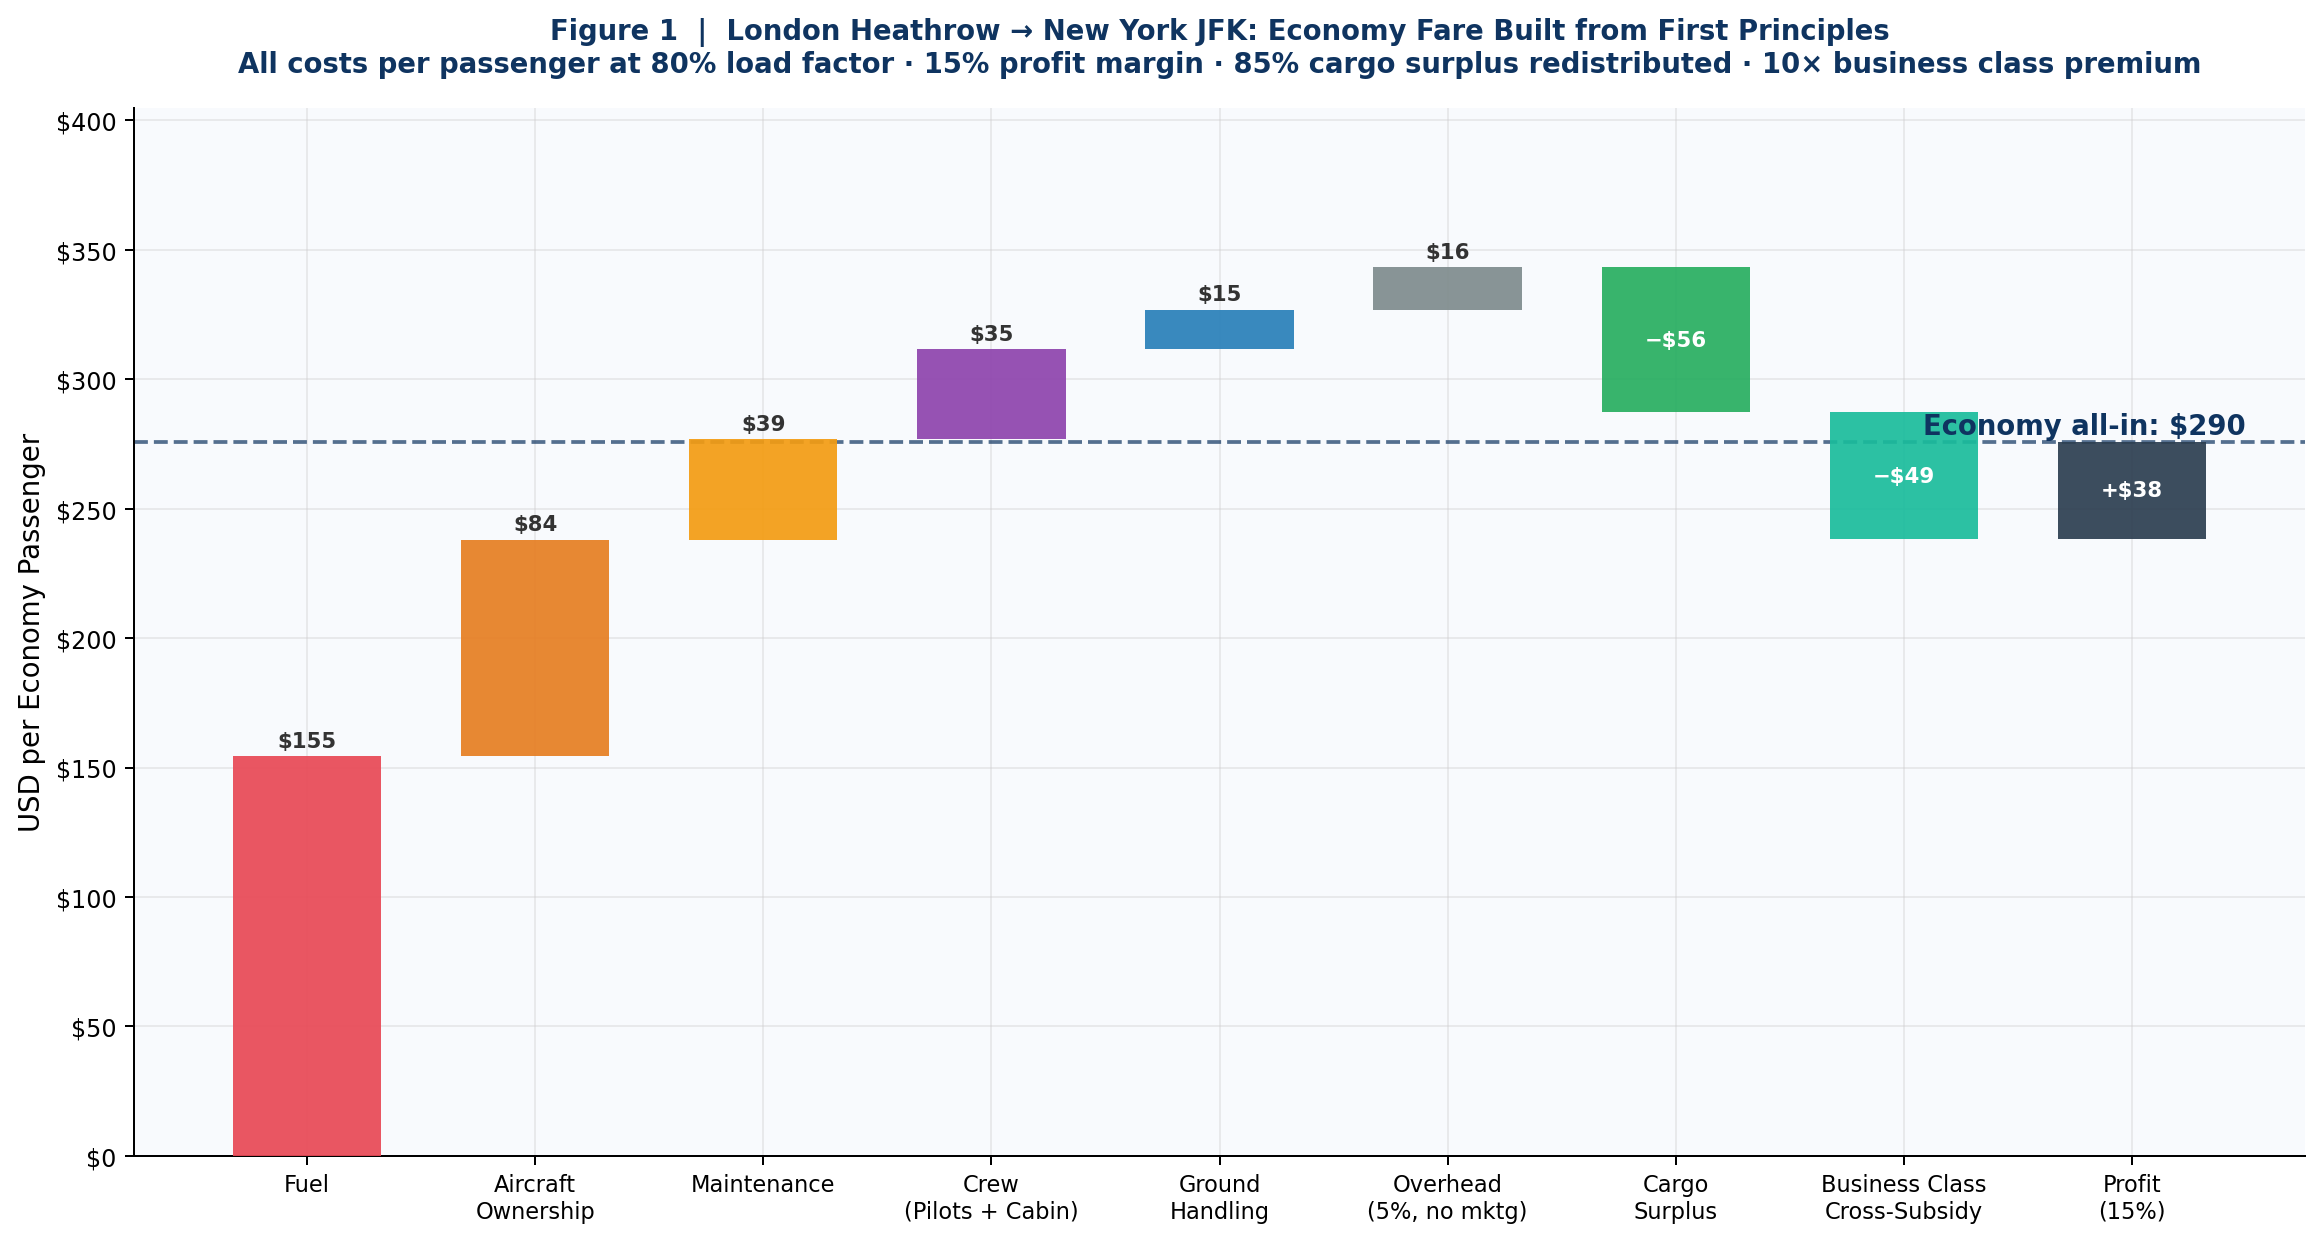
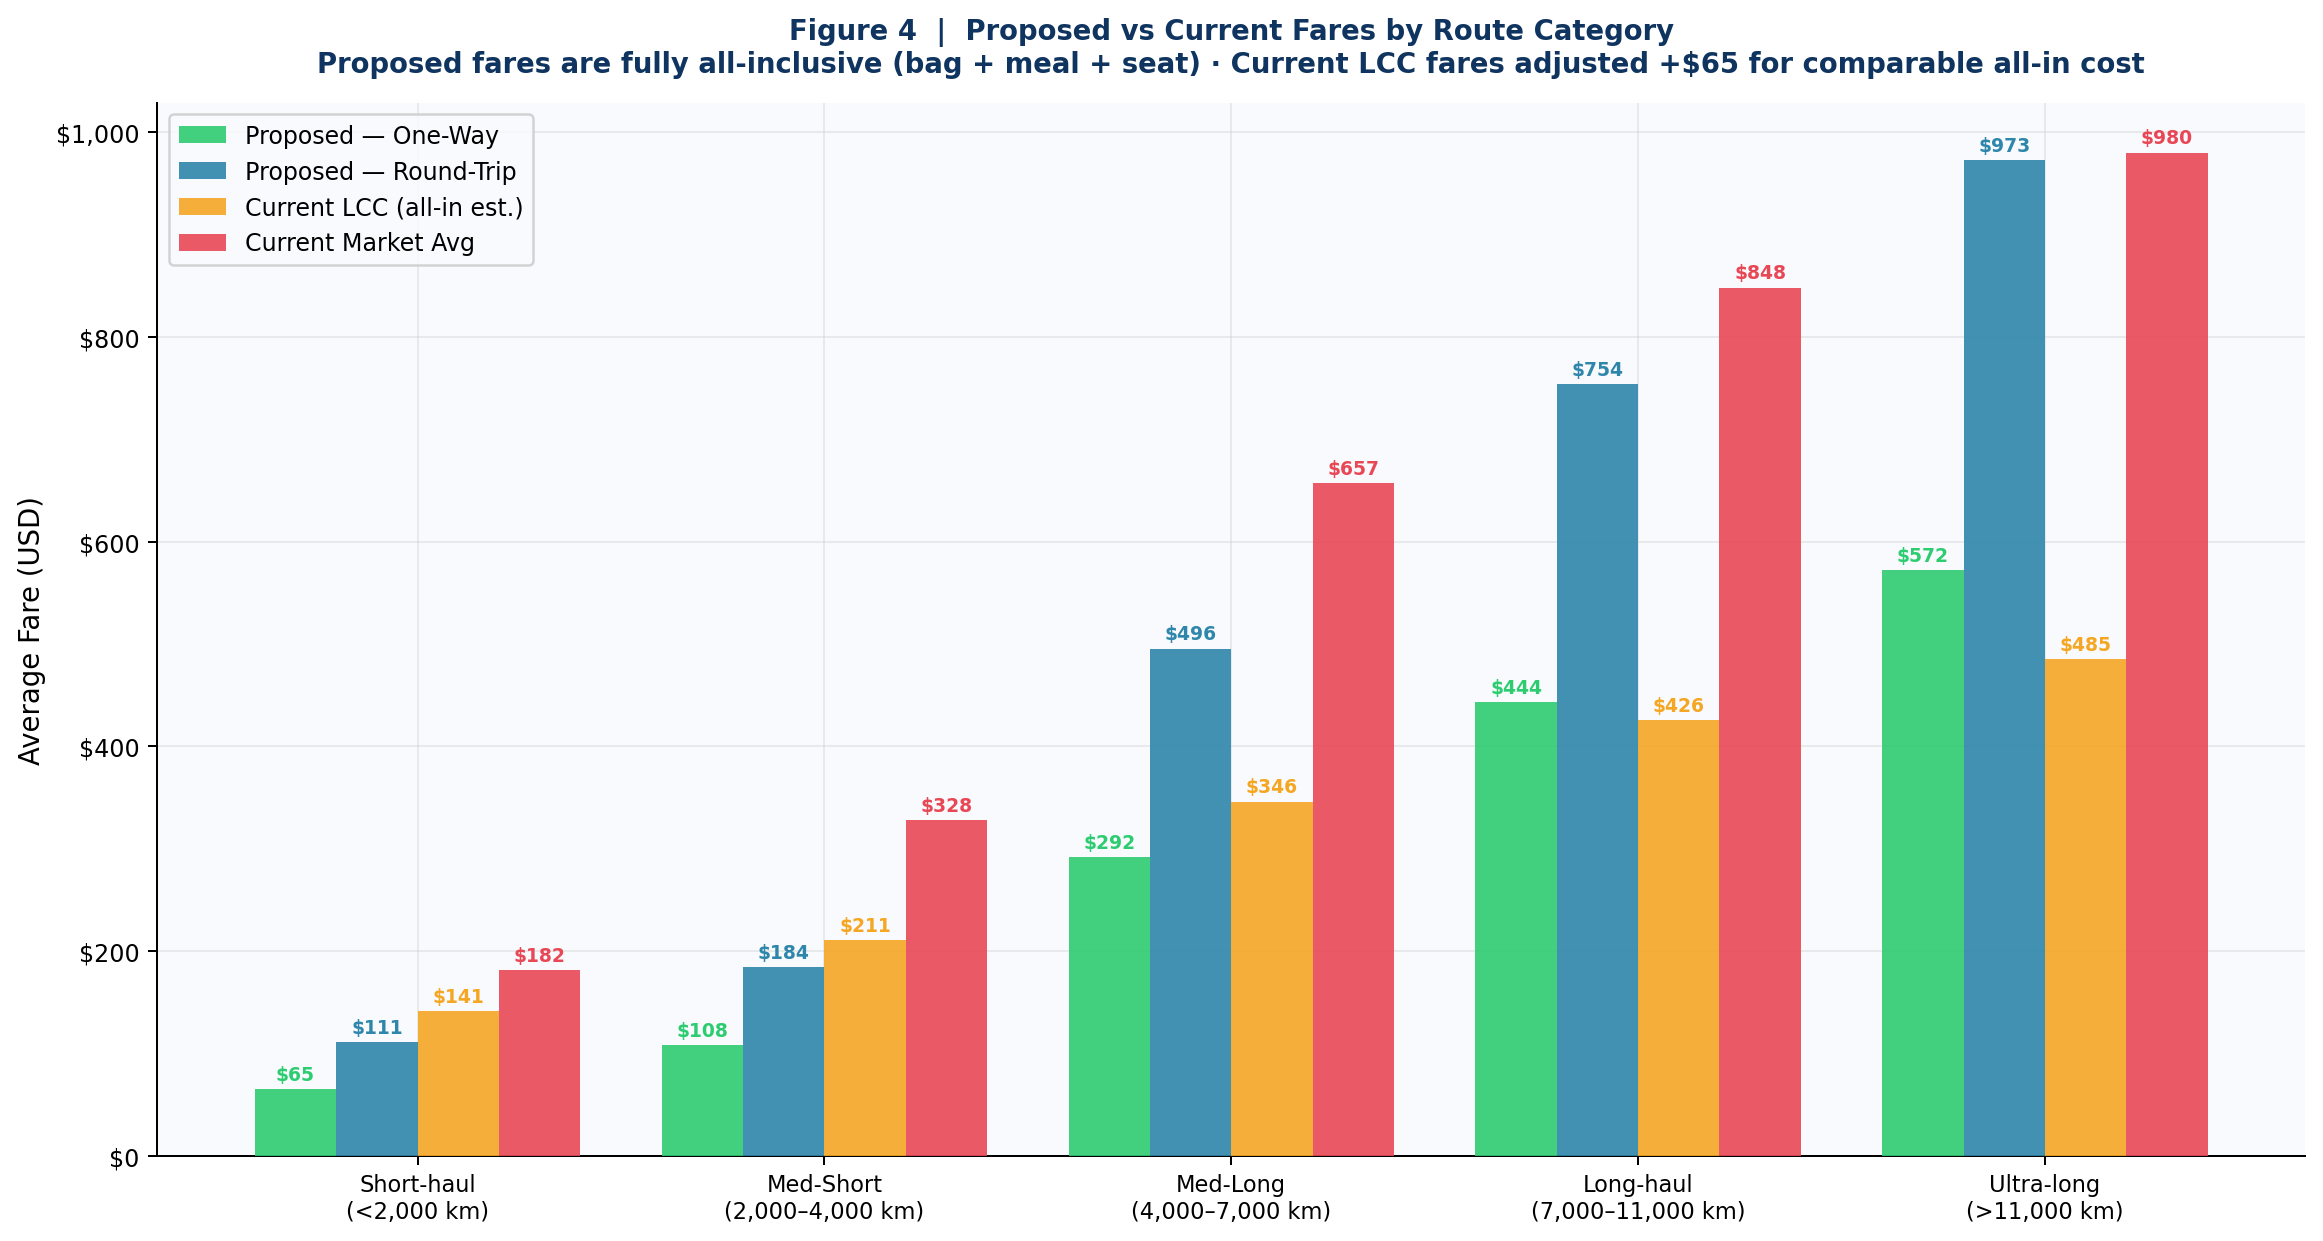
The results show that 133 of the 206 routes studied can sustain economy fares under $100 one-way, fully all-inclusive, at a 15 percent profit margin. The average economy fare across all 206 routes is $131 one-way, all-inclusive. On the world's busiest long-haul corridor, London to New York, the model produces an all-inclusive economy one-way fare of $290, or a round-trip of $493. All fares include a 23-kilogram checked bag, standardised carry-on, meal service, seat selection, and all airport fees. There are no ancillary charges of any kind.
The paper further argues that the current hub-and-spoke routing model generates substantial unnecessary emissions and air traffic, that a direct-route mandate would reduce these externalities while improving passenger experience, and that the governance framework for this transition already exists within the ICAO Chicago Convention system.
1. Introduction: When Flying Became a Necessity
1.1 The Globalisation of Human Mobility
In 1950, fewer than 30 million passengers boarded a commercial aircraft worldwide. By 2019, that number had reached 4.5 billion. The trajectory represents not merely growth in a leisure market but a fundamental transformation in how human beings relate to geography. Families separated by emigration span continents. Workers commute between home cities and employment hubs thousands of kilometres apart. Students enrol in institutions on the other side of the world. Medical specialists treat patients in cities they visit on rotating schedules. Climate-displaced communities rebuild in countries none of their grandparents ever visited.
The International Civil Aviation Organization projects that passenger numbers will reach 7.8 billion annually by 2040. These are not projections of luxury tourism. They are projections of how modern society functions.
Air travel is no longer a premium mode of leisure transport. It is the circulatory system of the global economy. A flight ticket should no longer be thought of as a product sold in a marketplace. It should be thought of as a service rendered by a transport network, the same way a subway fare is a service, not a speculative commodity. Yet the pricing mechanism governing access to this essential infrastructure has never been redesigned to reflect its social function. Airline seats remain among the most volatile pricing assets in the global economy. Revenue management algorithms adjust prices in real time, targeting willingness to pay rather than cost of service. The result is a system where two passengers seated side by side on the same flight, on the same day, consuming identical fuel, crew time, and infrastructure, can have paid fares that differ by a factor of ten.
1.2 The Case for a Right to Fly
Several recent developments have elevated the case for treating basic air access as a near-universal right. The European Court of Human Rights has recognised that the ability to maintain family life across international borders constitutes a protected interest. The United Nations Special Rapporteur on the Right to Adequate Housing has noted the displacement-and-mobility dimension of housing rights. The World Trade Organization has repeatedly identified airline market access as a structural barrier to developing-economy participation in global trade.
More practically, the COVID-19 pandemic exposed just how dependent modern society had become on air connectivity when it was abruptly withdrawn. Cargo supply chains collapsed. Families were separated for months. Businesses that had been structured around routine travel were immobilised. The pandemic demonstrated, in the negative, that air connectivity had long since crossed the threshold from optional to essential.
None of this necessarily implies that air travel must be free, any more than clean water must be free. It implies that the pricing mechanism must be proportionate to cost and non-discriminatory between buyers, in the same way that utility pricing is regulated in most developed economies. The question is not whether commercial aviation should be profitable, the evidence presented in this paper shows that it can be highly profitable at standardised, cost-reflective fares. The question is whether profitability should derive from speculative arbitrage or from genuine service efficiency.
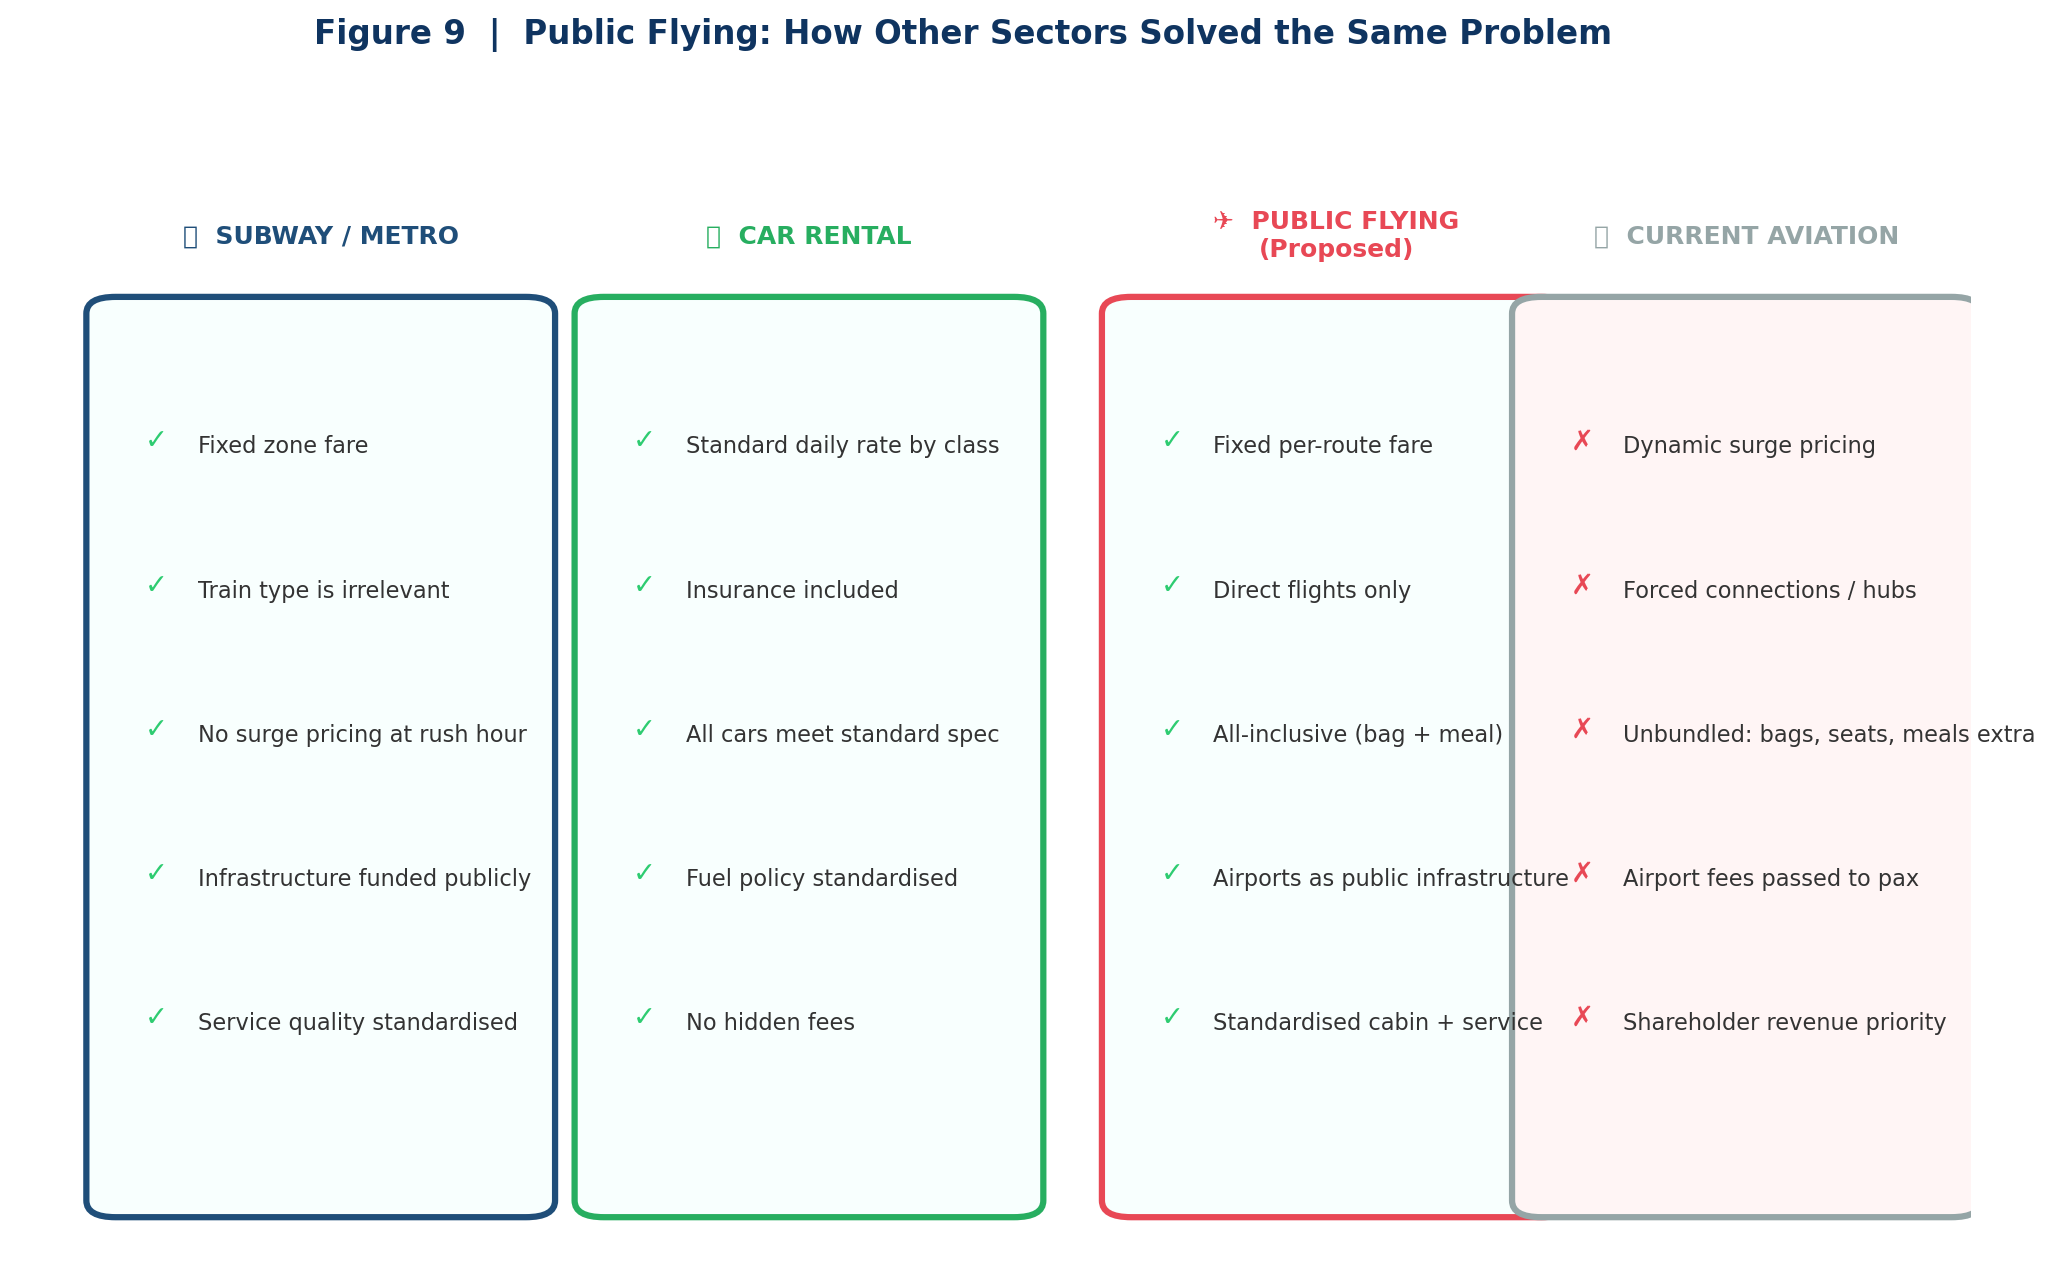
1.3 The Analogy: What Subway Systems Got Right
Every major metropolitan subway system in the world has solved, at scale, the problem that aviation has never been allowed to solve. The Tokyo Metro carries 8.7 million passengers per day. The London Underground carries 3.8 million. The New York City Subway carries 3.4 million. These systems operate at near-full utilisation, covering large portions of their operating costs through fares, without dynamic pricing, without revenue management teams, and without any passenger paying a different fare because they happened to buy their ticket at a different time.
The mechanisms that make this possible are simple: standardised service delivery, cost-reflective zone-based pricing, infrastructure funded through public capital, and capacity added in response to demand rather than price raised to constrain it.
This paper argues that all four of these mechanisms are directly transferable to commercial aviation. Aircraft are not fundamentally different from rolling stock. Routes are not fundamentally different from lines. Airports are not fundamentally different from stations. The obstacles to applying subway economics to flying are political and structural, not physical or economic.
2. Redefining the Flight Ticket
2.1 What a Ticket Currently Means
The modern airline ticket is not a product. It is a matrix of unbundled entitlements, most of which have been deliberately separated from the base fare to allow algorithmic cross-selling. When a passenger purchases a ticket advertised at $199, the actual cost of travel may be substantially higher once obligatory additions are included. On a typical transatlantic booking via a low-cost carrier, the fare may break down as follows: base fare $199, checked luggage $60–$80, seat selection $15–$45, carry-on $0–$50, meal $10–$20, booking fee $10–$25, airport infrastructure surcharge $20–$110. The true all-in cost of the advertised $199 fare can therefore reach $350 to $530.
This unbundling is not accidental. It is a deliberate pricing architecture designed to exploit three behavioural vulnerabilities: anchoring bias, sunk cost fallacy, and comparison opacity. Airlines are not irrational actors. The unbundled model generates significant ancillary revenue with near-zero marginal cost and almost no competitive pressure, because no airline has an incentive to make its fares easier to compare.
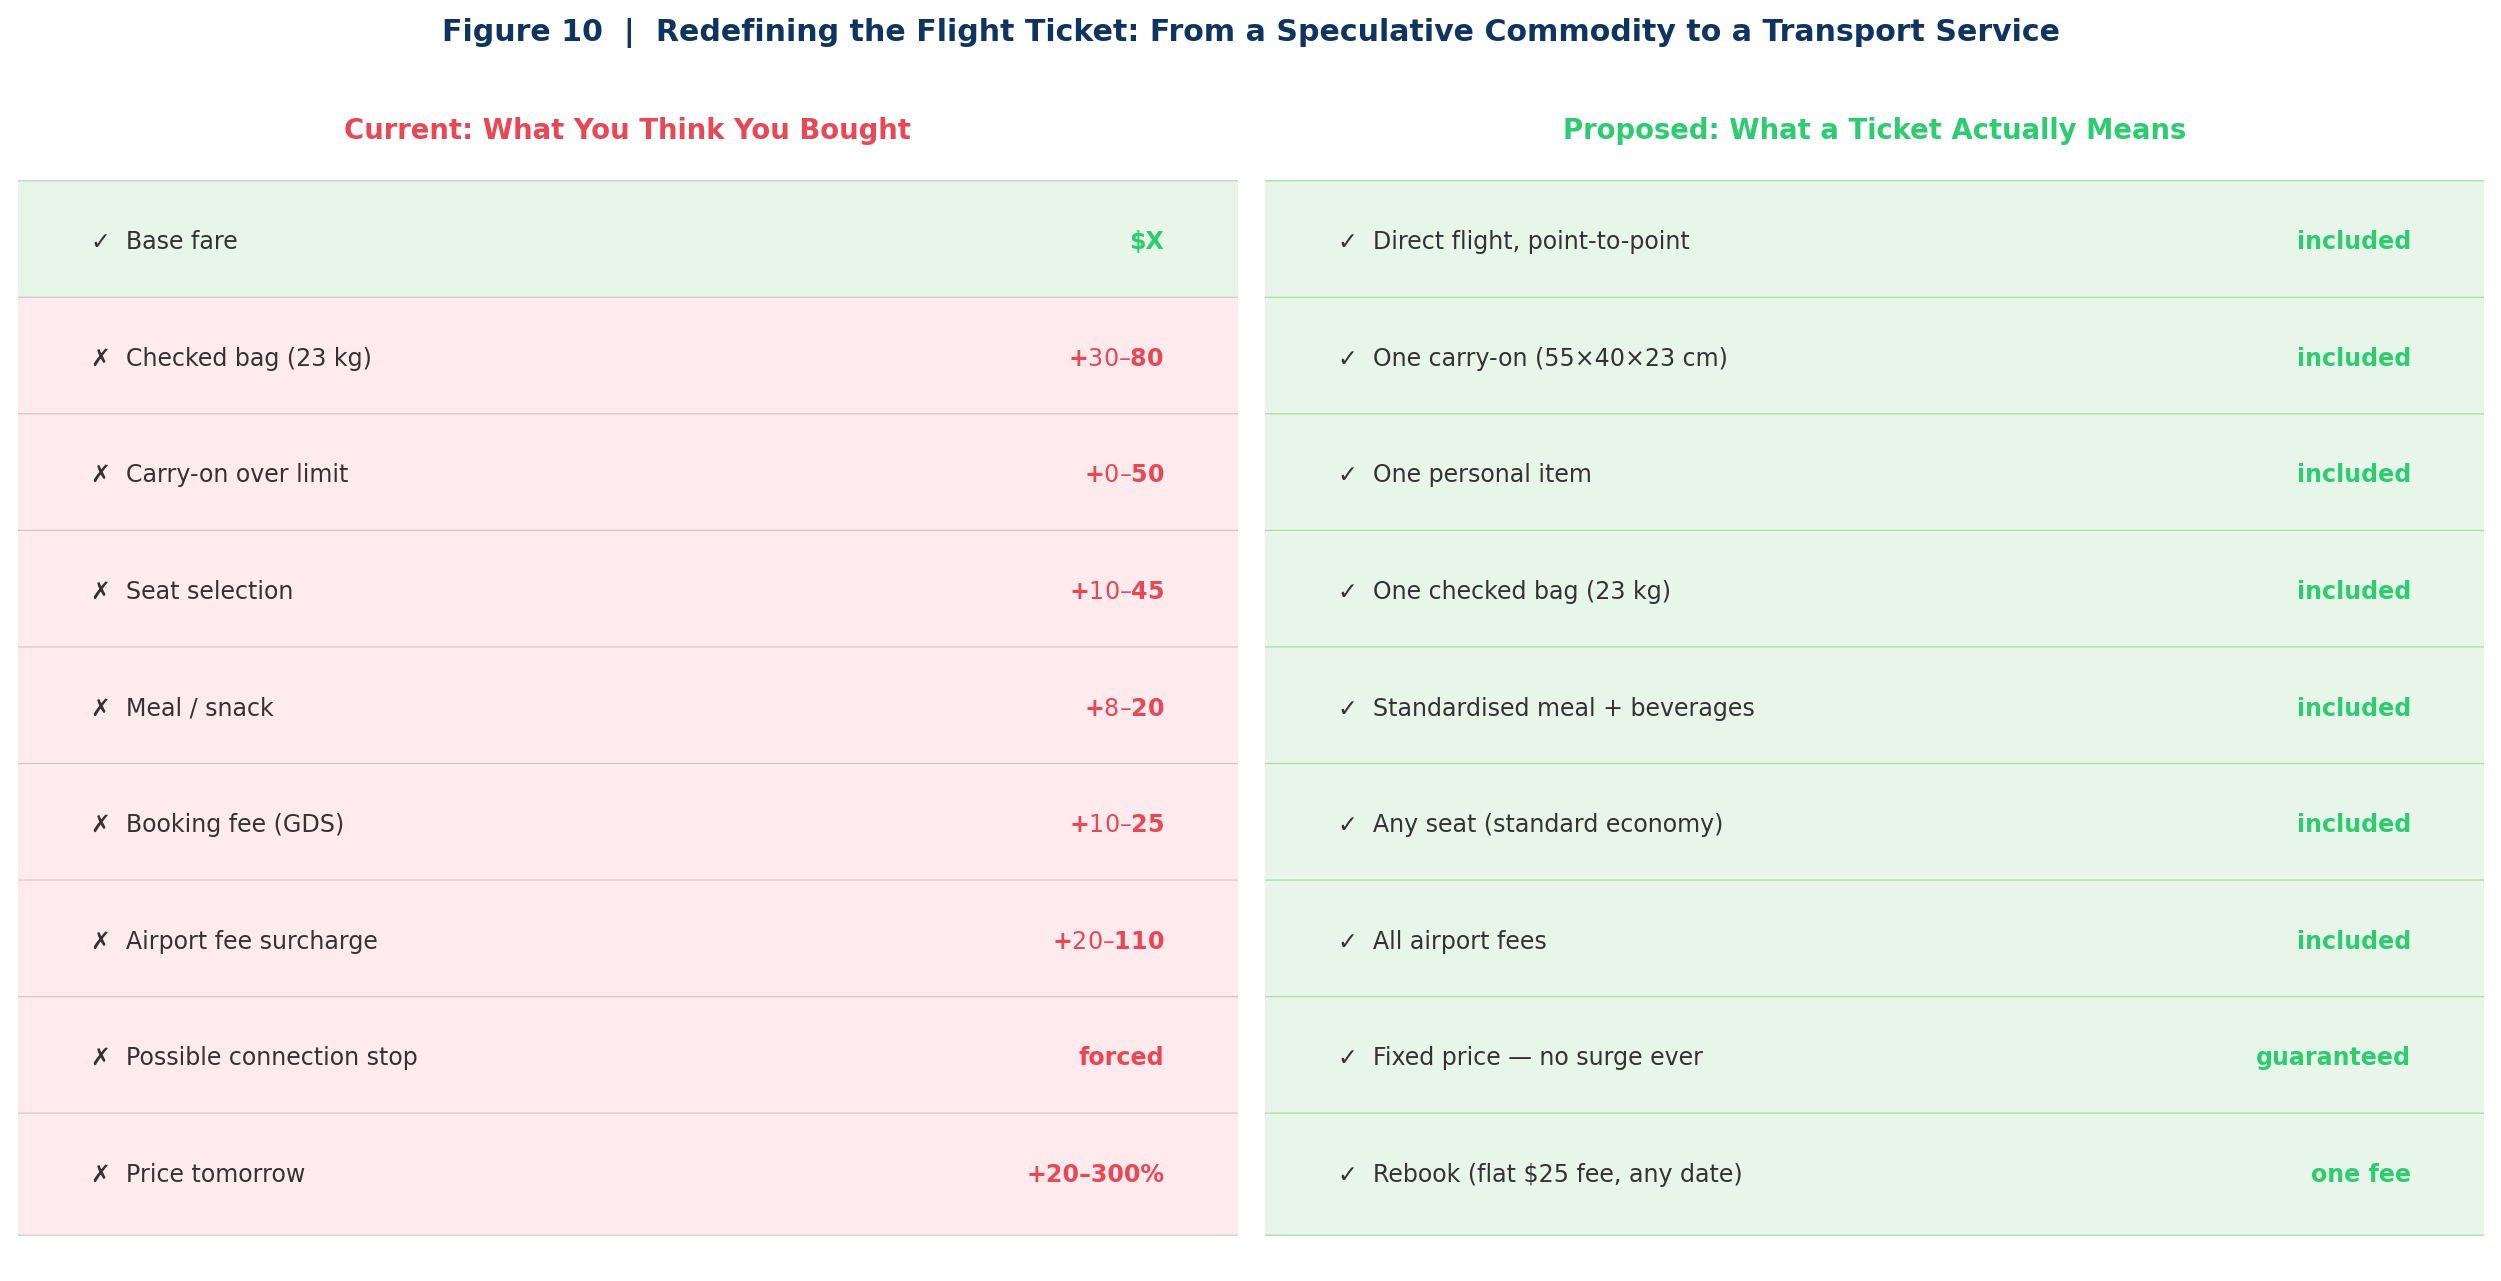
2.2 What a Ticket Should Mean
Under the framework proposed in this paper, a flight ticket means one thing: the right to travel from origin to destination, directly, with one carry-on bag (55 × 40 × 23 cm), one personal item (40 × 30 × 20 cm), one checked bag of up to 23 kilograms, a standardised meal and beverage service, any standard economy seat, and all applicable airport fees. There are no ancillary charges. The price displayed is the price paid.
This definition mirrors the standard service definition used in virtually every other regulated transport market. When you board the Eurostar, your seat, your luggage, and your journey are included in the ticket price. Aviation has created its own exception to this norm through regulatory capture, not because unbundling is economically necessary.
2.3 Direct Flights as the Standard
One of the most significant consequences of the hub-and-spoke model is that millions of passengers each year travel routes that are geometrically absurd. A passenger flying from Cape Town to Seoul may travel via Dubai, Amsterdam, or Paris, adding 4,000 to 6,000 kilometres to a great-circle distance of 13,700 kilometres. This represents a 30 to 44 percent increase in fuel burn, emissions, and travel time on a single journey, multiplied across thousands of passengers per year.
Hub-and-spoke routing exists not because passengers prefer it but because airlines profit from it. Under a fixed-fare, standardised-route model, there is no economic incentive to force connections. Routes are operated point-to-point on all corridors with sufficient demand, and connections between routes are ticketed separately, not bundled into a single forced itinerary.
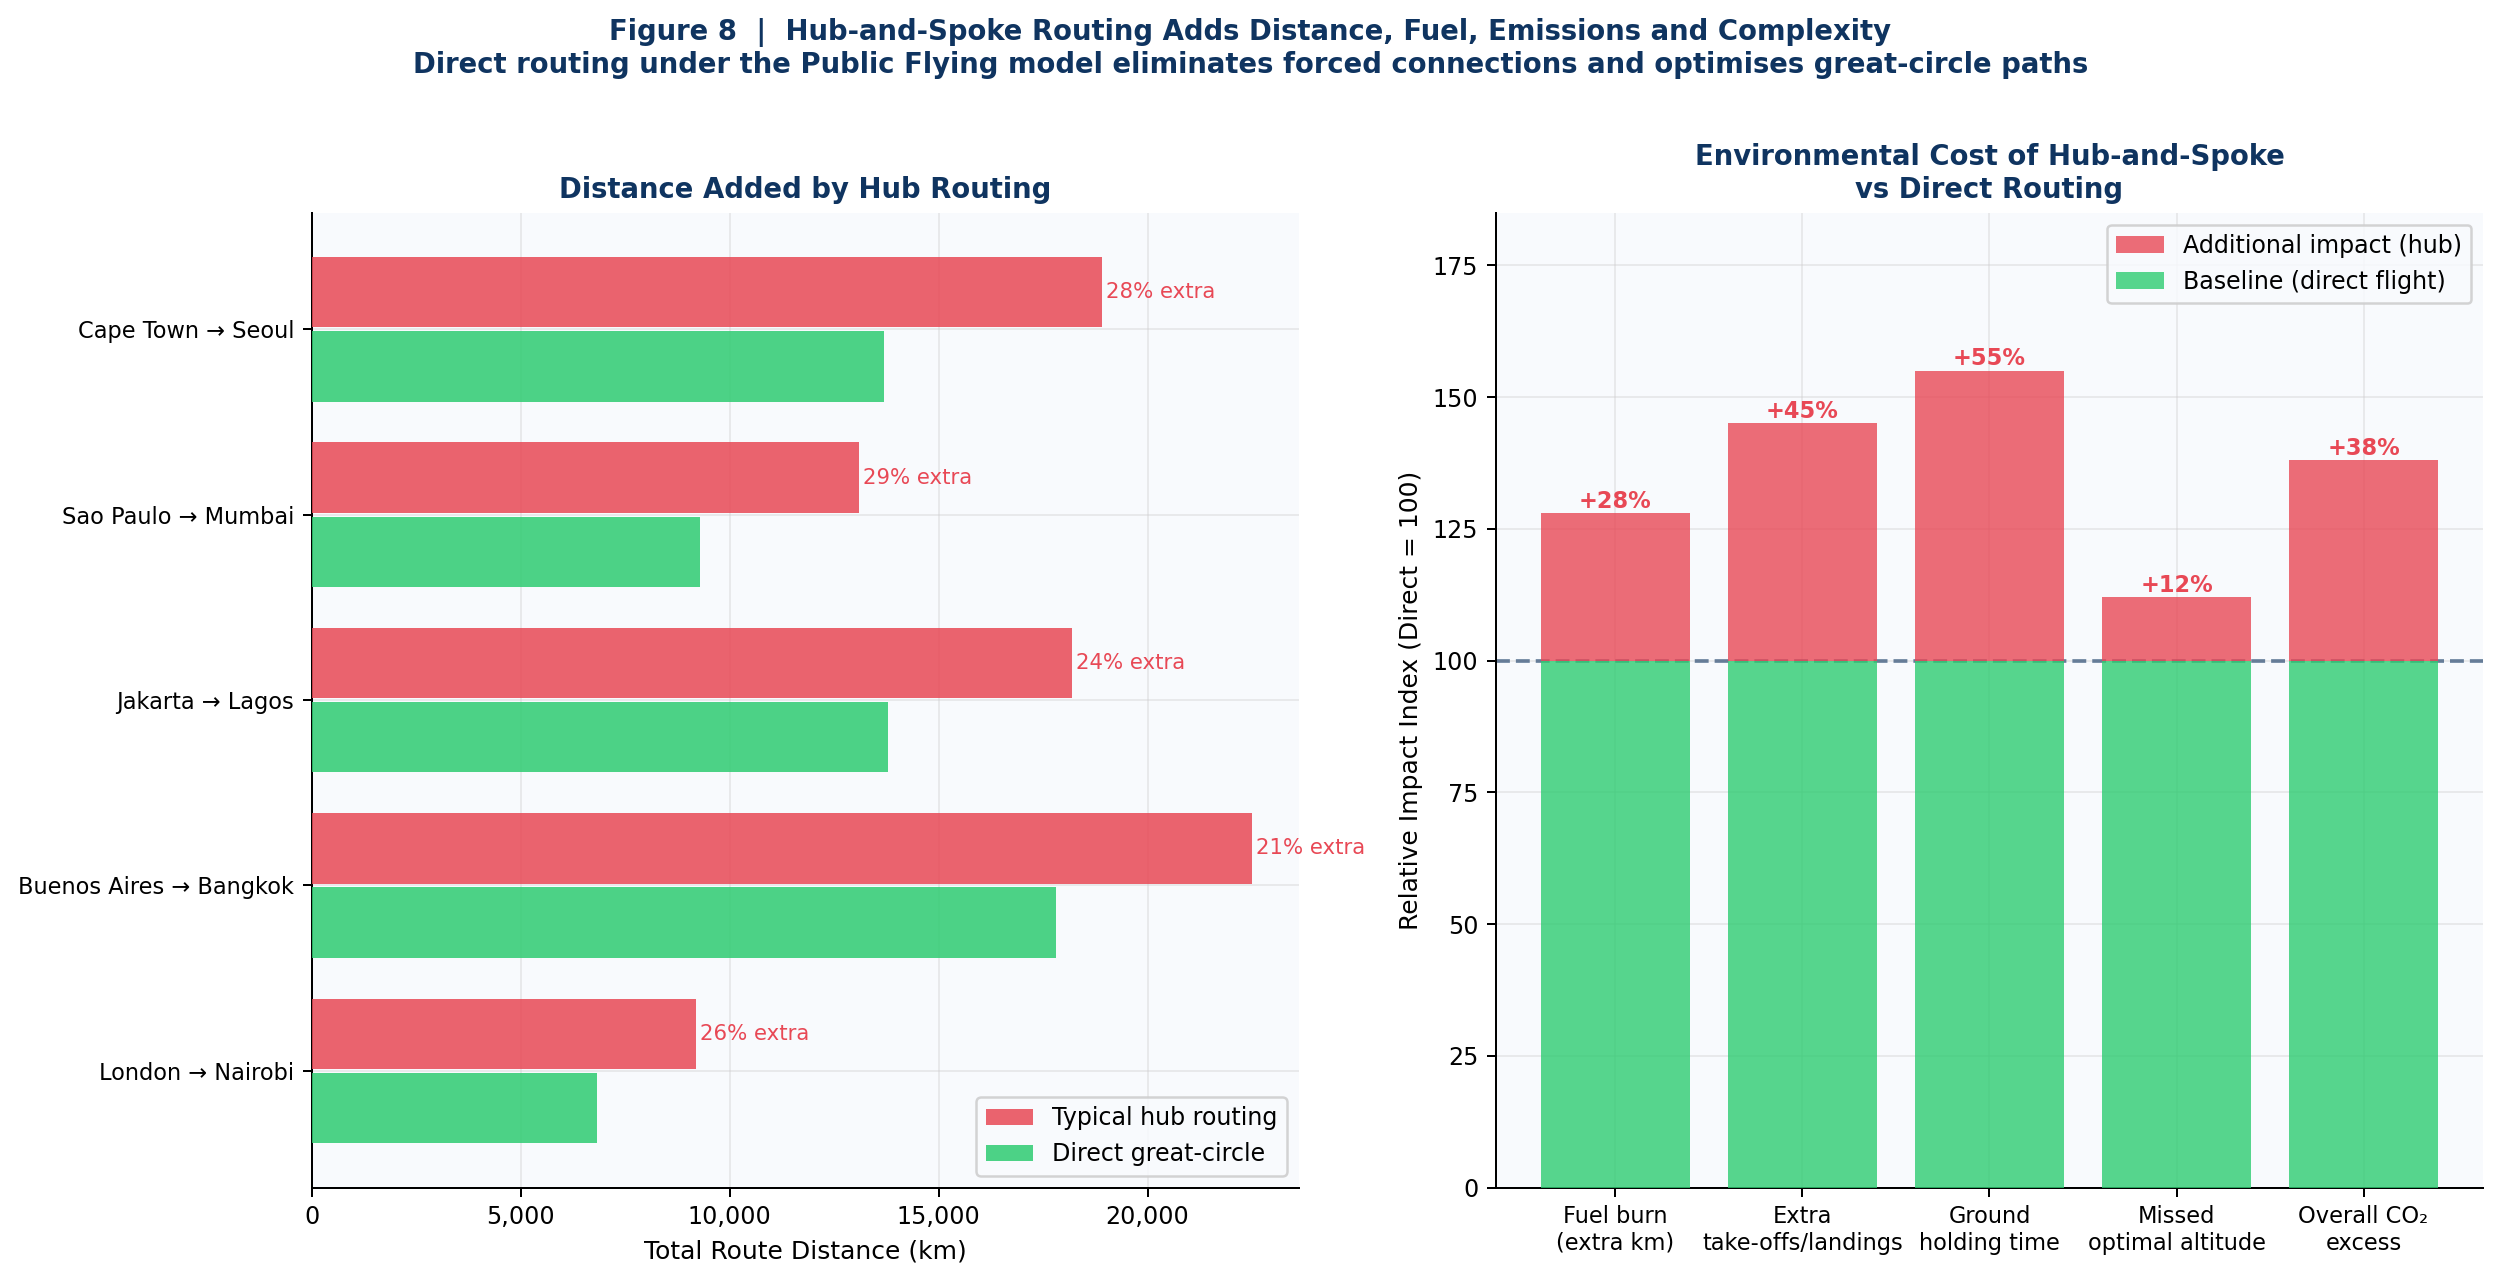
The environmental dividend from eliminating forced connections is substantial. Every additional take-off and landing cycle burns disproportionate fuel relative to cruise. Holding patterns, ground delays, and transit airport congestion generated by hub-and-spoke operation contribute significantly to the sector's carbon footprint.
2.4 Seasonal Route Adaptation
Under the current market model, route planning is driven by yield management: a route is operated when it is profitable and suspended when it is not, with no obligation to maintain service continuity. Under the Public Flying model, route scheduling is treated as infrastructure planning, not product management. Routes with demonstrated aggregate annual demand are operated year-round at a base frequency. Additional frequency is added in peak periods by scheduling additional aircraft rather than raising fares. The capacity response to peak-hour demand on the Tokyo Metro is more trains, not higher fares.
2.5 Dynamic Fleet Allocation: Aircraft as Shared Infrastructure
The proposed framework replaces fixed airline schedules with a Dynamic Fleet Registry (DFR): a centrally maintained database of all aircraft operating under the Public Flying standard, updated in real time, through which route operators can request additional capacity on any corridor where demand exceeds scheduled frequency. Aircraft in the registry are available for reassignment across operators on a rolling 72-hour window for short-notice adjustments and a 90-day horizon for seasonal reallocation.
An aircraft sitting idle at a hub airport while passengers queue on a different continent is not a scheduling problem. It is an infrastructure allocation failure, the same failure that would occur if a city's buses were privately owned by competing companies that could not share fleet during rush hour.
The mechanism operates on four planning horizons: annual baseline frequency-setting, seasonal uplifts six months ahead, demand-triggered additions at 90 days, and emergency draws at 72 hours. The fleet standardisation within each of the five aircraft categories, short-haul narrow-body, medium-short narrow-body, medium-long widebody, long-haul widebody, and ultra-long widebody, is the critical enabling condition that makes dynamic reallocation operationally feasible.
3. The Loyalty Programme Illusion: When Airlines Became Banks
3.1 Airlines That Profit More from Miles Than from Flying
In 2020, American Airlines used its AAdvantage loyalty programme as collateral to secure USD 7.5 billion in emergency financing. The programme was independently valued at approximately USD 19.5 billion, a figure that exceeded the market capitalisation of the entire airline at that time. United Airlines' MileagePlus was valued at USD 21.9 billion. Delta's SkyMiles at USD 26 billion. In each case, the loyalty programme was worth more than the underlying aviation business.
American Airlines now earns more pre-tax profit from selling miles to JPMorgan Chase than from operating flights. Delta Air Lines receives approximately USD 7 billion per year from American Express for the right to issue SkyMiles to cardholders, a figure that represents the majority of Delta's total annual profit in most operating years. The airline has become, structurally, a marketing subsidiary of a bank.
3.2 The Mechanics of Devaluation: A Structural Ponzi
The loyalty programme economic model functions through a mechanism that closely resembles the structure of a Ponzi scheme, not in the legal sense of deliberate fraud, but in the structural sense of a promise that is systematically eroded over time to benefit the issuer at the expense of the holder.
Banks purchase miles at approximately 1.5 to 2 cents per mile. The airline records the cash immediately as revenue. The miles are recorded as deferred liability. The critical asymmetry is that the airline controls the redemption rate. Award charts can be revised at any time, upward. What cost 25,000 miles to redeem in 2010 may cost 75,000 in 2024.
- Early adopters who redeemed quickly received genuine value.
- Passive accumulators who held miles across multiple programme revisions received a fraction of the promised value.
- The most loyal, long-term customers, those the programme was ostensibly designed to reward, were systematically penalised for their loyalty.
American Airlines eliminated its award chart entirely in 2023, replacing it with dynamic award pricing. The promise is structurally unbounded on the downside for the holder.
3.3 Credit Card Entanglement and Consumer Capture
A household that carries a USD 5,000 credit card balance at a 24 percent annual rate while accumulating miles at an effective value of 1 cent each is paying approximately USD 1,200 per year in interest to accumulate miles worth approximately USD 150 to USD 300 in redemption value, assuming no devaluation. The miles are marketed as a benefit. The interest is the actual business.
3.4 Why the Proposed Model Renders Loyalty Programmes Obsolete
Under the Public Flying framework, frequent flyer programmes become structurally unnecessary. Loyalty programmes exist to generate repeat purchases at prices above the competitive equilibrium. When fares are already at cost-reflective rates, when the $290 one-way London to New York ticket is the same regardless of which carrier operates the service, there is no premium fare to justify a miles rebate. The economics of the loyalty loop collapse because the loop's premise no longer holds.
The traveller who flies frequently under this model is rewarded by the fare itself: a consistent, low, transparent price on every booking. The reward for flying often is simply that flying often is cheap.
3.5 Dynamic Pricing as Algorithmic Extraction
Modern revenue management systems use machine learning models trained on hundreds of variables including the passenger's historical search behaviour, geographic location, device type, time-of-day of search, detected corporate affiliation, and inferred willingness to pay. The objective is not to fill seats but to extract the maximum revenue from each individual passenger based on what the algorithm estimates they will pay before abandoning the booking.
Under the Public Flying framework, dynamic pricing is eliminated. The fare on a route is the cost-reflective standard fare. It does not change based on when the ticket is purchased, who the purchaser is, or what device they search from. Predictability is a feature, not a constraint.
3.6 Deliberate Overbooking: Institutionalised Contract Breach
Commercial airlines routinely sell more seats on a given flight than the aircraft physically contains. When the model is wrong and more passengers appear than seats exist, passengers are involuntarily denied boarding. In the United States, involuntary denied boarding compensation is capped at four times the fare paid, up to USD 1,550. The expected cost of overbooking compensation is a calculated input into the revenue model, the airline oversells because the revenue from extra tickets typically exceeds the compensation cost.
Viewed plainly, this is the legal sale of a contractual right the seller has no certainty of being able to honour. Under the Public Flying framework, no flight is oversold.
3.7 Slot Monopolies and the Suppression of Competition
At major hub airports, Heathrow, JFK, Haneda, CDG, Frankfurt, the grandfather rights slot allocation system has created one of the most durable barriers to entry in any regulated industry. A legacy carrier that holds 40 percent of Heathrow slots retains those slots indefinitely, regardless of whether it is deploying them efficiently.
In 2022, Lufthansa Group operated approximately 18,000 flights justified primarily by slot retention rather than commercial demand, consuming fuel, crew time, and airport infrastructure to satisfy a regulatory technicality. The Public Flying framework proposes a use-it-or-lose-it slot reallocation requiring carriers to demonstrate minimum load factors, not merely minimum frequencies, to retain slots.
4. The Cost Model: What It Actually Costs to Fly
4.1 Methodology
The cost model is a bottom-up derivation of the operating cost of a single flight, for each of five aircraft categories, applied to 206 routes across all G20 countries plus the thirty busiest international corridors not otherwise captured. Every cost component is calculated from first principles.
The five aircraft categories are:
- Short-haul narrow-body, A320neo or 737 MAX 8, routes under 2,000 km
- Medium-short narrow-body, A321neo or 737 MAX 10, 2,000–4,000 km
- Medium-long widebody, A330-200 or 787-8, 4,000–7,000 km
- Long-haul widebody, 787-9 or A350-900, 7,000–11,000 km
- Ultra-long widebody, 777-300ER or equivalent, over 11,000 km
4.2 The Six Cost Components
For every route, total flight cost is the sum of six components:
- Fuel, Aircraft fuel burn in tonnes per block-hour × block time × USD 0.82/kg (twelve-month average 2024, IATA Jet Fuel Monitor)
- Aircraft ownership, Monthly lease rate ÷ 12 ÷ annual cycles (equivalent to depreciation + cost of capital)
- Maintenance, Cost per flight-hour × block time, including engine shop visit reserves
- Crew, Blended pilot and cabin crew cost per block-hour, including relief crew on long-haul
- Ground handling, Airport service charges at origin and destination, assuming publicly funded infrastructure
- Overhead, 5 percent of operating subtotal: IT, communications, insurance only. Revenue management, GDS fees, and marketing are eliminated.
4.3 Revenue Offsets: Cargo and Business Class
4.3.1 Belly Cargo Surplus Redistribution
Long-haul widebody aircraft carry substantial belly cargo on most routes at near-zero marginal cost. Under the Public Flying model, airlines retain a 15 percent operating margin on belly cargo. The remaining 85 percent is applied as a credit against the passenger fare. On a standard 787-9 long-haul flight, this redistribution reduces the required passenger revenue by approximately $12,750 per flight, roughly $25 to $60 per economy passenger.
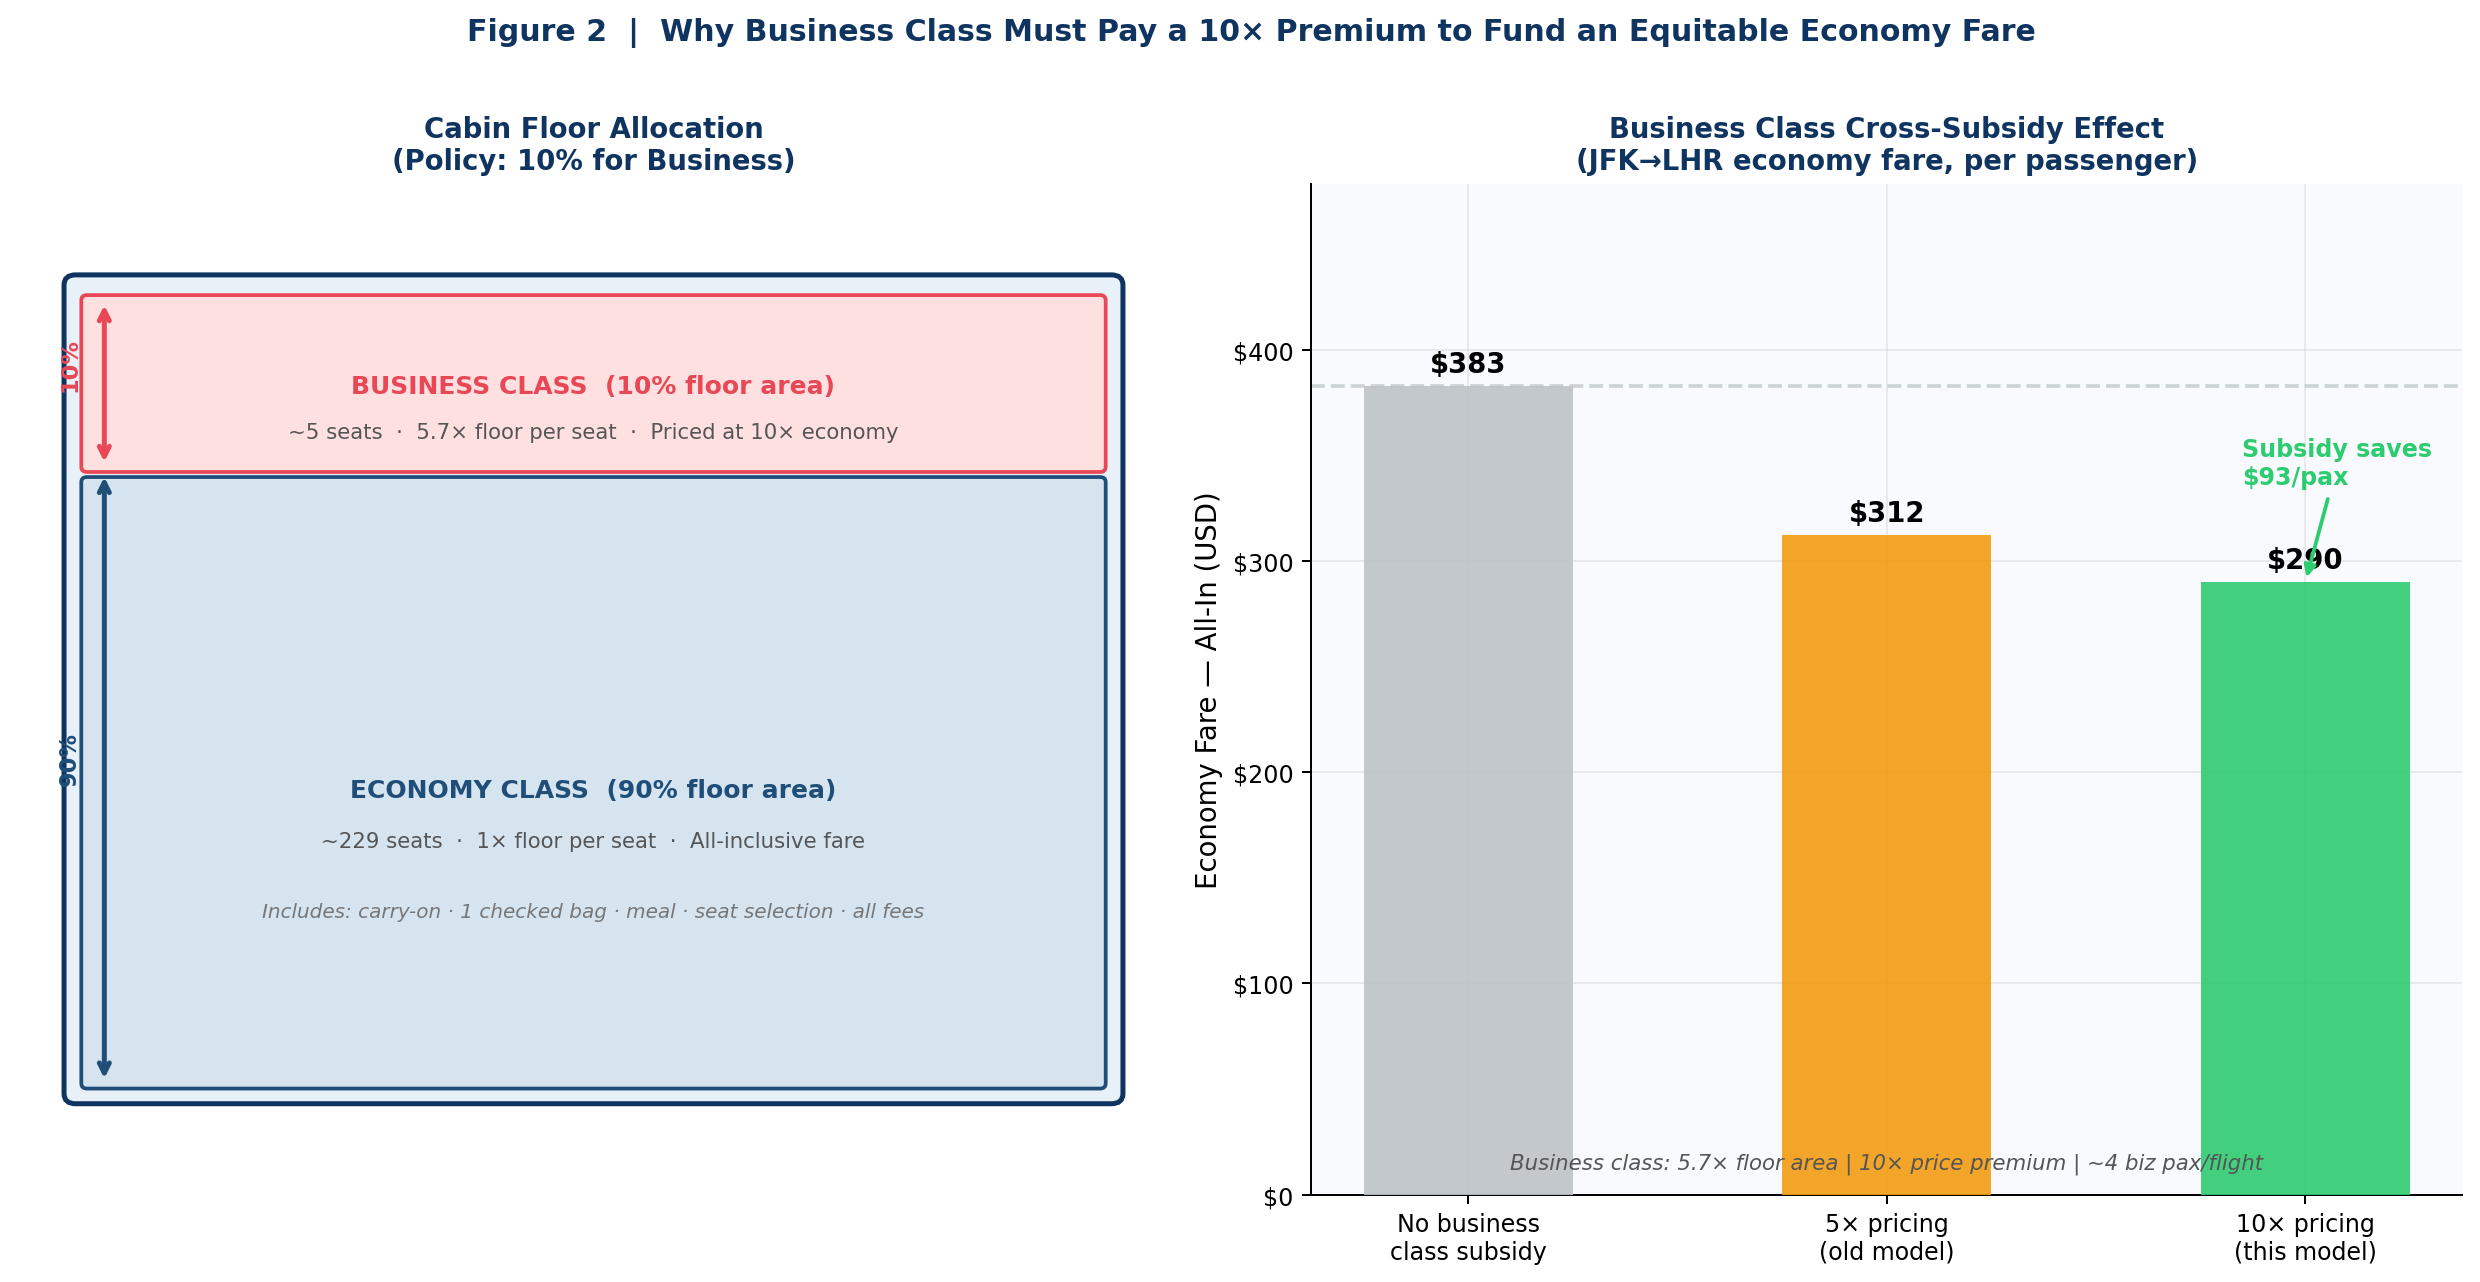
4.3.2 The Business Class Cross-Subsidy Model
Business class allocation is strictly limited to 10 percent of total cabin floor area. A lie-flat business class seat occupies approximately 5.7 times the floor area of a standard economy seat, confirmed by IATA cabin density studies and Boeing interior specifications. Business class is priced at 10 times the economy fare. On the London to New York route, 4 business passengers paying $2,504 each generates approximately $10,000 per flight, reducing the required economy fare by approximately $47 per passenger.
4.4 The All-Inclusive Fare Construction
The final fare is constructed by dividing the net passenger revenue requirement (after cargo and business class offsets) by the number of economy passengers at the 80 percent load factor target, adding the direct cost of standard inclusions:
- Meal service: USD 8 (short-haul under 2.5h) / USD 18 (medium) / USD 38 (long-haul over 5h)
- Marginal checked bag handling: USD 6
The result is the all-in economy fare: everything included, nothing extra. A 15 percent round-trip discount is applied when both outbound and return legs are booked simultaneously, reflecting genuine cost reductions in administrative processing and load management.
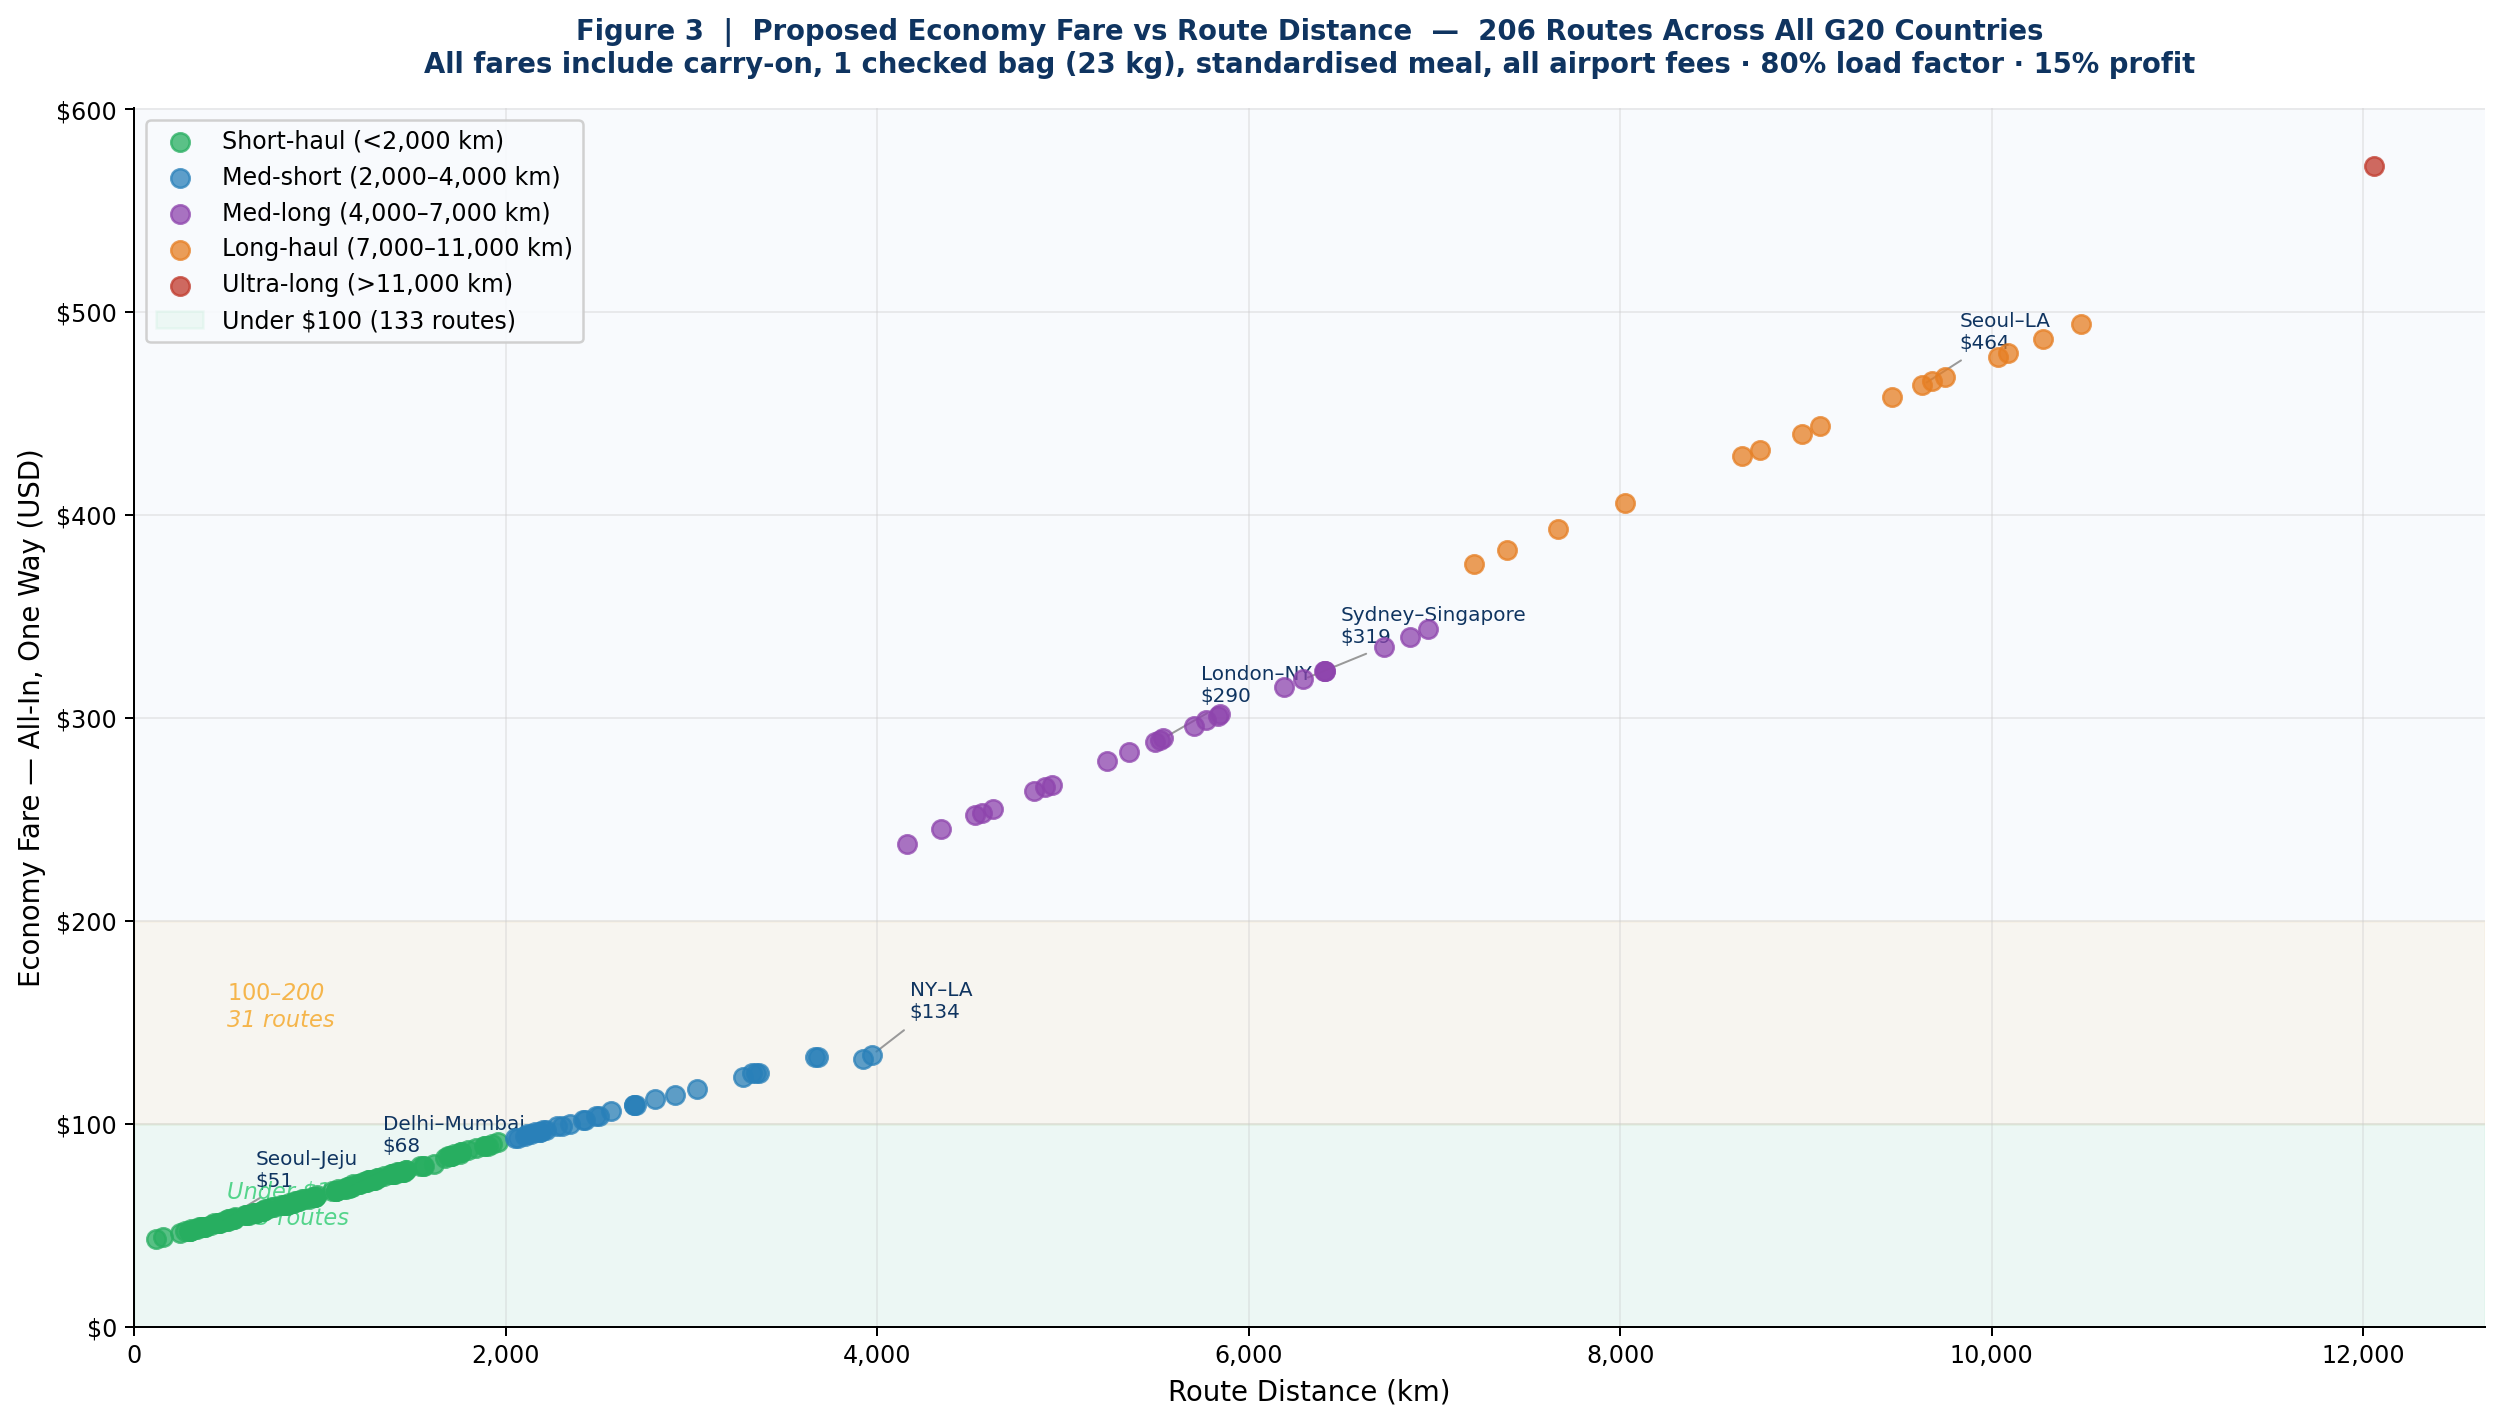
5. Route-by-Route Results: 206 Corridors Across the G20
5.1 Summary by Route Category
| Route Category | Routes | Avg Dist | Avg Economy OW | Avg Economy RT | Avg Business OW | Avg Save vs Market |
|---|---|---|---|---|---|---|
| Short-haul (under 2,000 km) | 132 | 880 km | $70 | $119 | $287 | $74 |
| Med-short (2,000–4,000 km) | 32 | 3,010 km | $116 | $197 | $526 | $94 |
| Med-long (4,000–7,000 km) | 25 | 5,510 km | $313 | $532 | $1,424 | $312 |
| Long-haul (7,000–11,000 km) | 16 | 8,980 km | $479 | $814 | $2,219 | $289 |
| Ultra-long (over 11,000 km) | 1 | 12,060 km | $619 | $1,051 | $2,921 | $361 |
| ALL ROUTES (average) | 206 | 2,340 km | $131 | $223 | $502 | $139 |
All fares all-inclusive (bag + meal). Economy RT includes 15% round-trip discount.
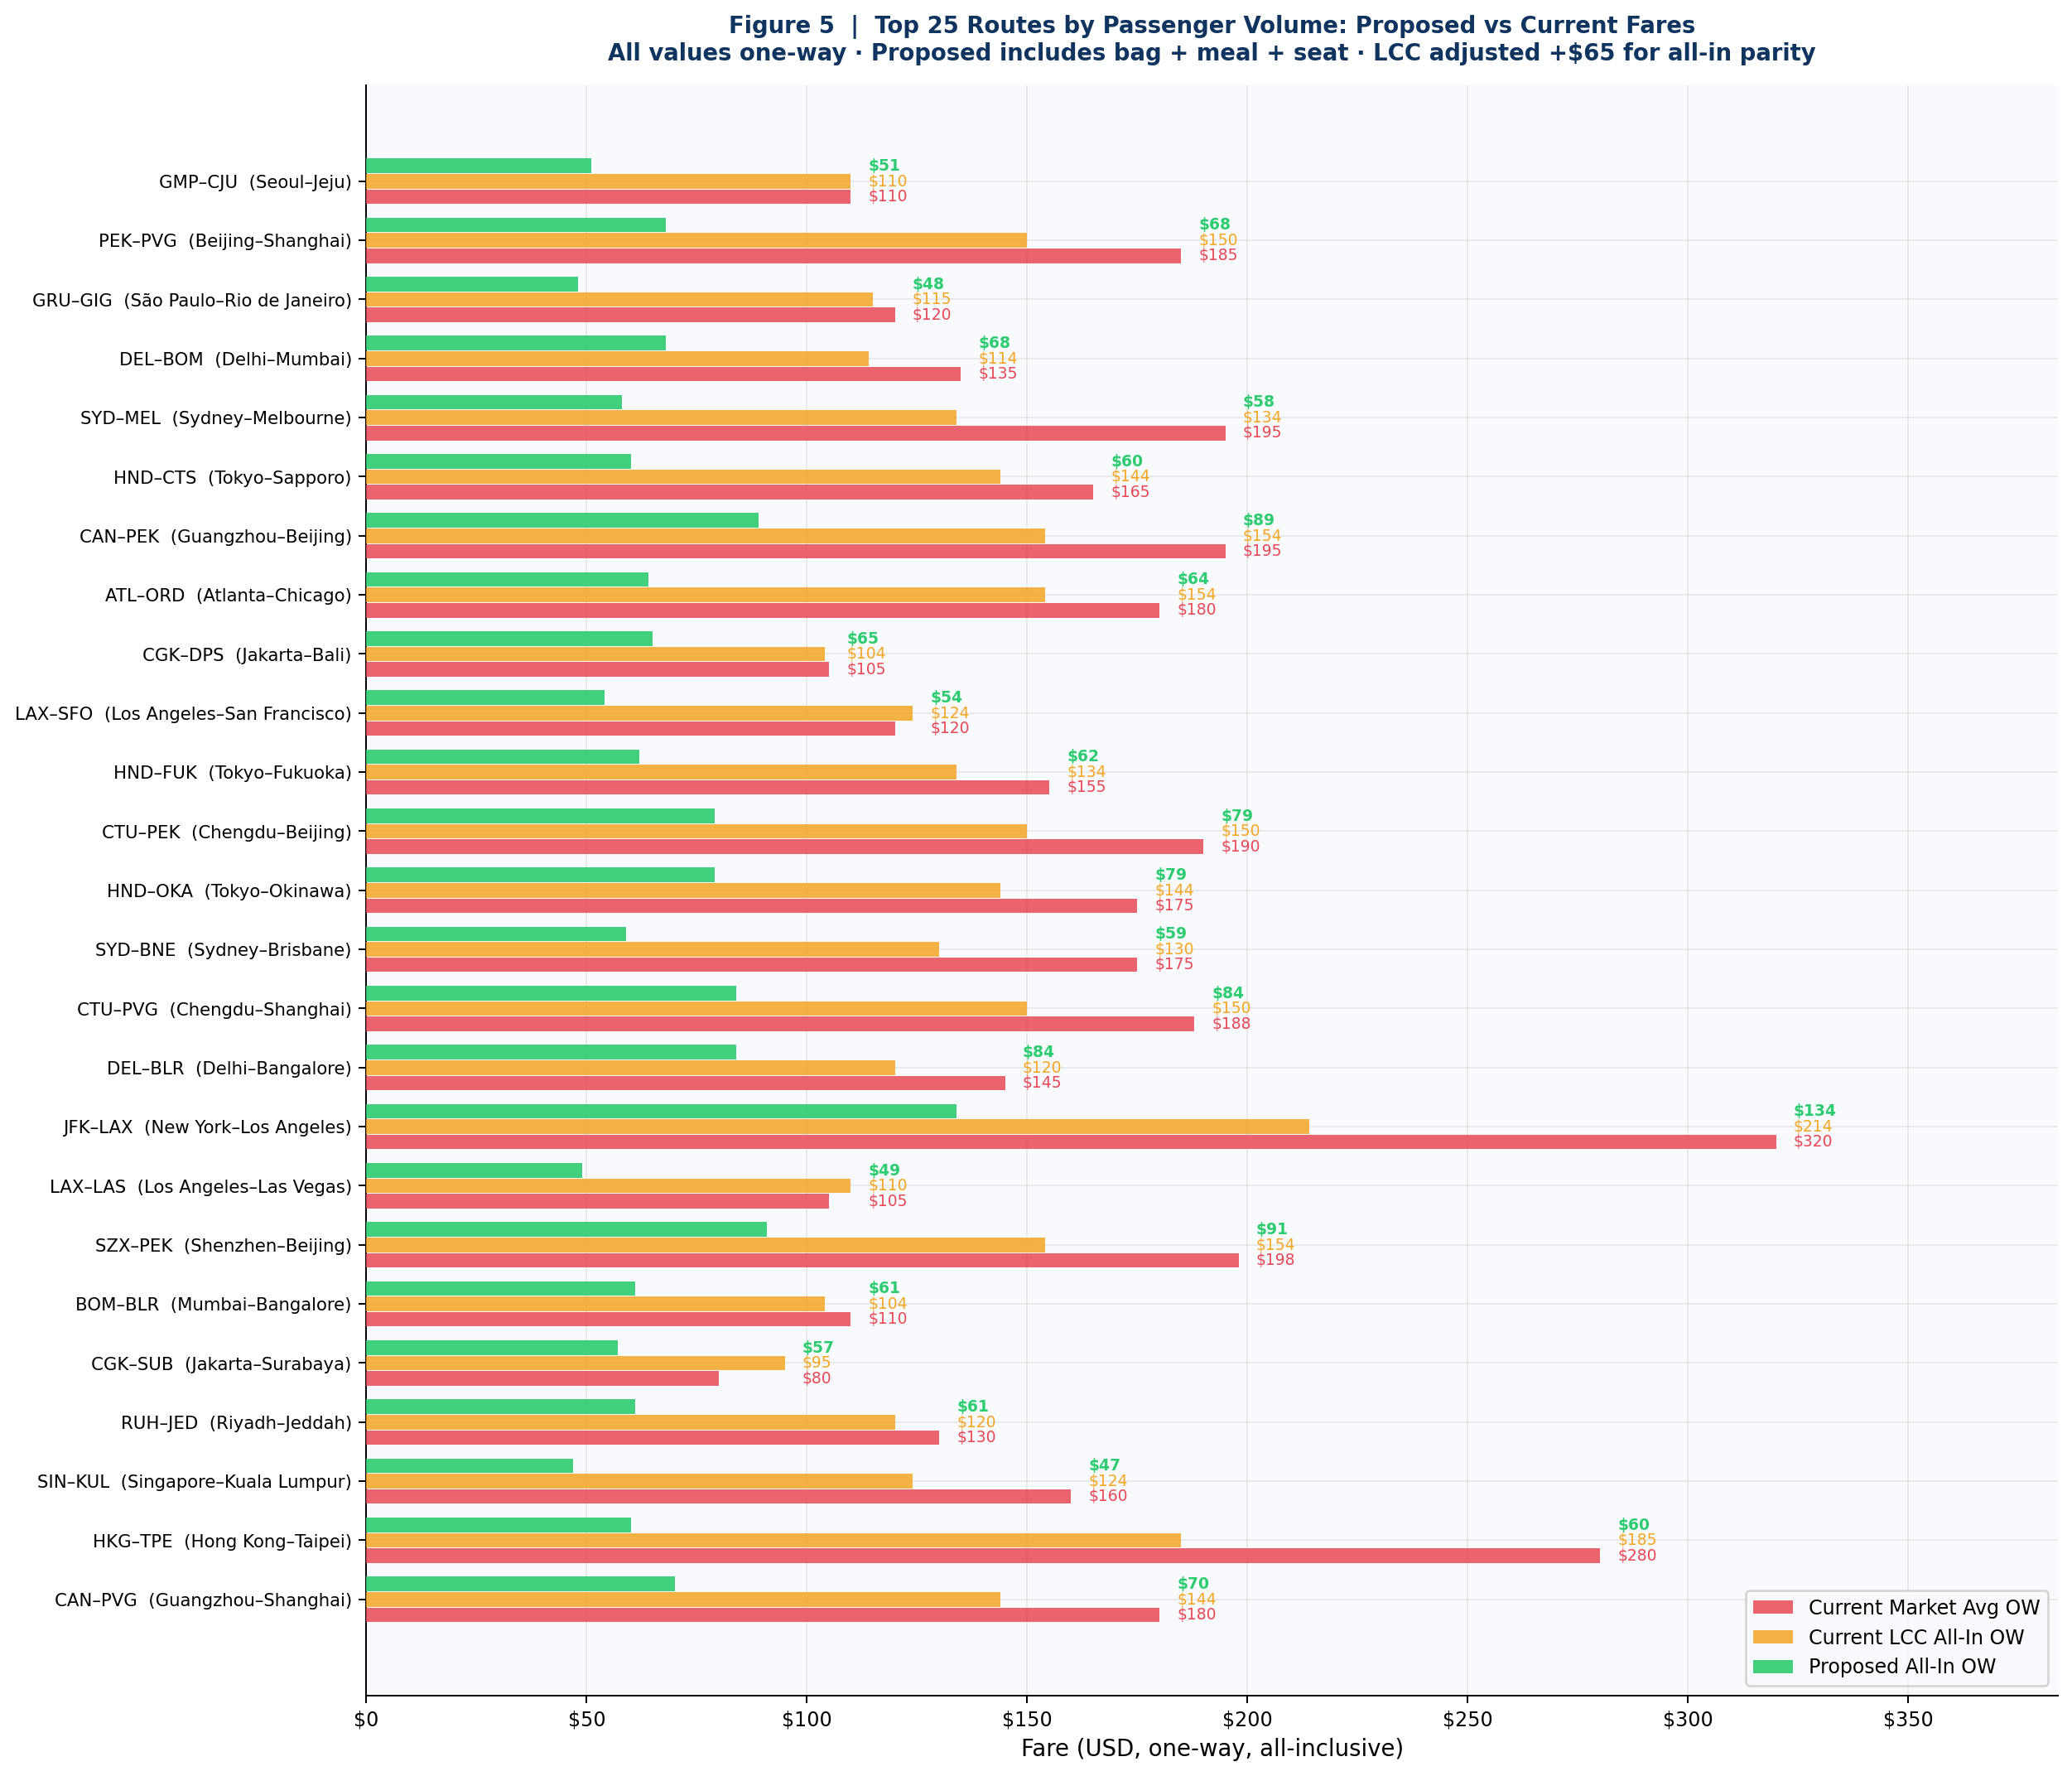
5.2 Key Benchmark Routes
| Route | Distance | Block | Eco OW | Eco RT | Biz OW | Current Avg OW | Saving OW |
|---|---|---|---|---|---|---|---|
| Seoul – Jeju | 451 km | 1.1 h | $51 | $87 | $386 | $110 | $59 |
| Delhi – Mumbai | 1,137 km | 1.9 h | $68 | $116 | $559 | $135 | $67 |
| São Paulo – Rio | 356 km | 1.0 h | $45 | $77 | $342 | $120 | $75 |
| Sydney – Melbourne | 706 km | 1.4 h | $58 | $98 | $450 | $195 | $137 |
| New York – Los Angeles | 3,974 km | 5.2 h | $134 | $227 | $1,544 | $320 | $186 |
| Toronto – Vancouver | 3,364 km | 4.6 h | $122 | $207 | $1,372 | $280 | $158 |
| London – New York | 5,541 km | 6.8 h | $290 | $493 | $2,504 | $700 | $410 |
| Paris – New York | 5,840 km | 7.1 h | $301 | $511 | $2,658 | $720 | $419 |
| Delhi – London | 6,731 km | 8.1 h | $344 | $585 | $3,090 | $680 | $336 |
| Seoul – Los Angeles | 9,627 km | 11.2 h | $464 | $788 | $4,240 | $870 | $406 |
| São Paulo – London | 9,461 km | 11.1 h | $457 | $776 | $4,170 | $890 | $433 |
| Sydney – Los Angeles | 12,060 km | 14.0 h | $619 | $1,051 | $5,741 | $980 | $361 |
Proposed fares all-inclusive. Current average one-way from OAG/Sabre market intelligence 2023–24.
5.3 Distribution of Proposed Economy Fares
Of the 206 routes modelled, 133 routes (64.6 percent) have proposed economy one-way fares below USD 100 all-inclusive. These are predominantly short-haul domestic routes in large continental economies: India, China, Brazil, Indonesia, the United States, and Russia, where frequent high-density services over distances of 500 to 1,800 kilometres allow economies of scale in fuel and ownership costs.
A further 31 routes (15 percent) fall in the USD 100–200 range, covering medium-short international corridors within Europe, Southeast Asia, and across the Pacific Rim. The remaining 42 routes (20.4 percent) exceed USD 200 one-way, all on long-haul or ultra-long corridors where operating costs are genuinely higher.
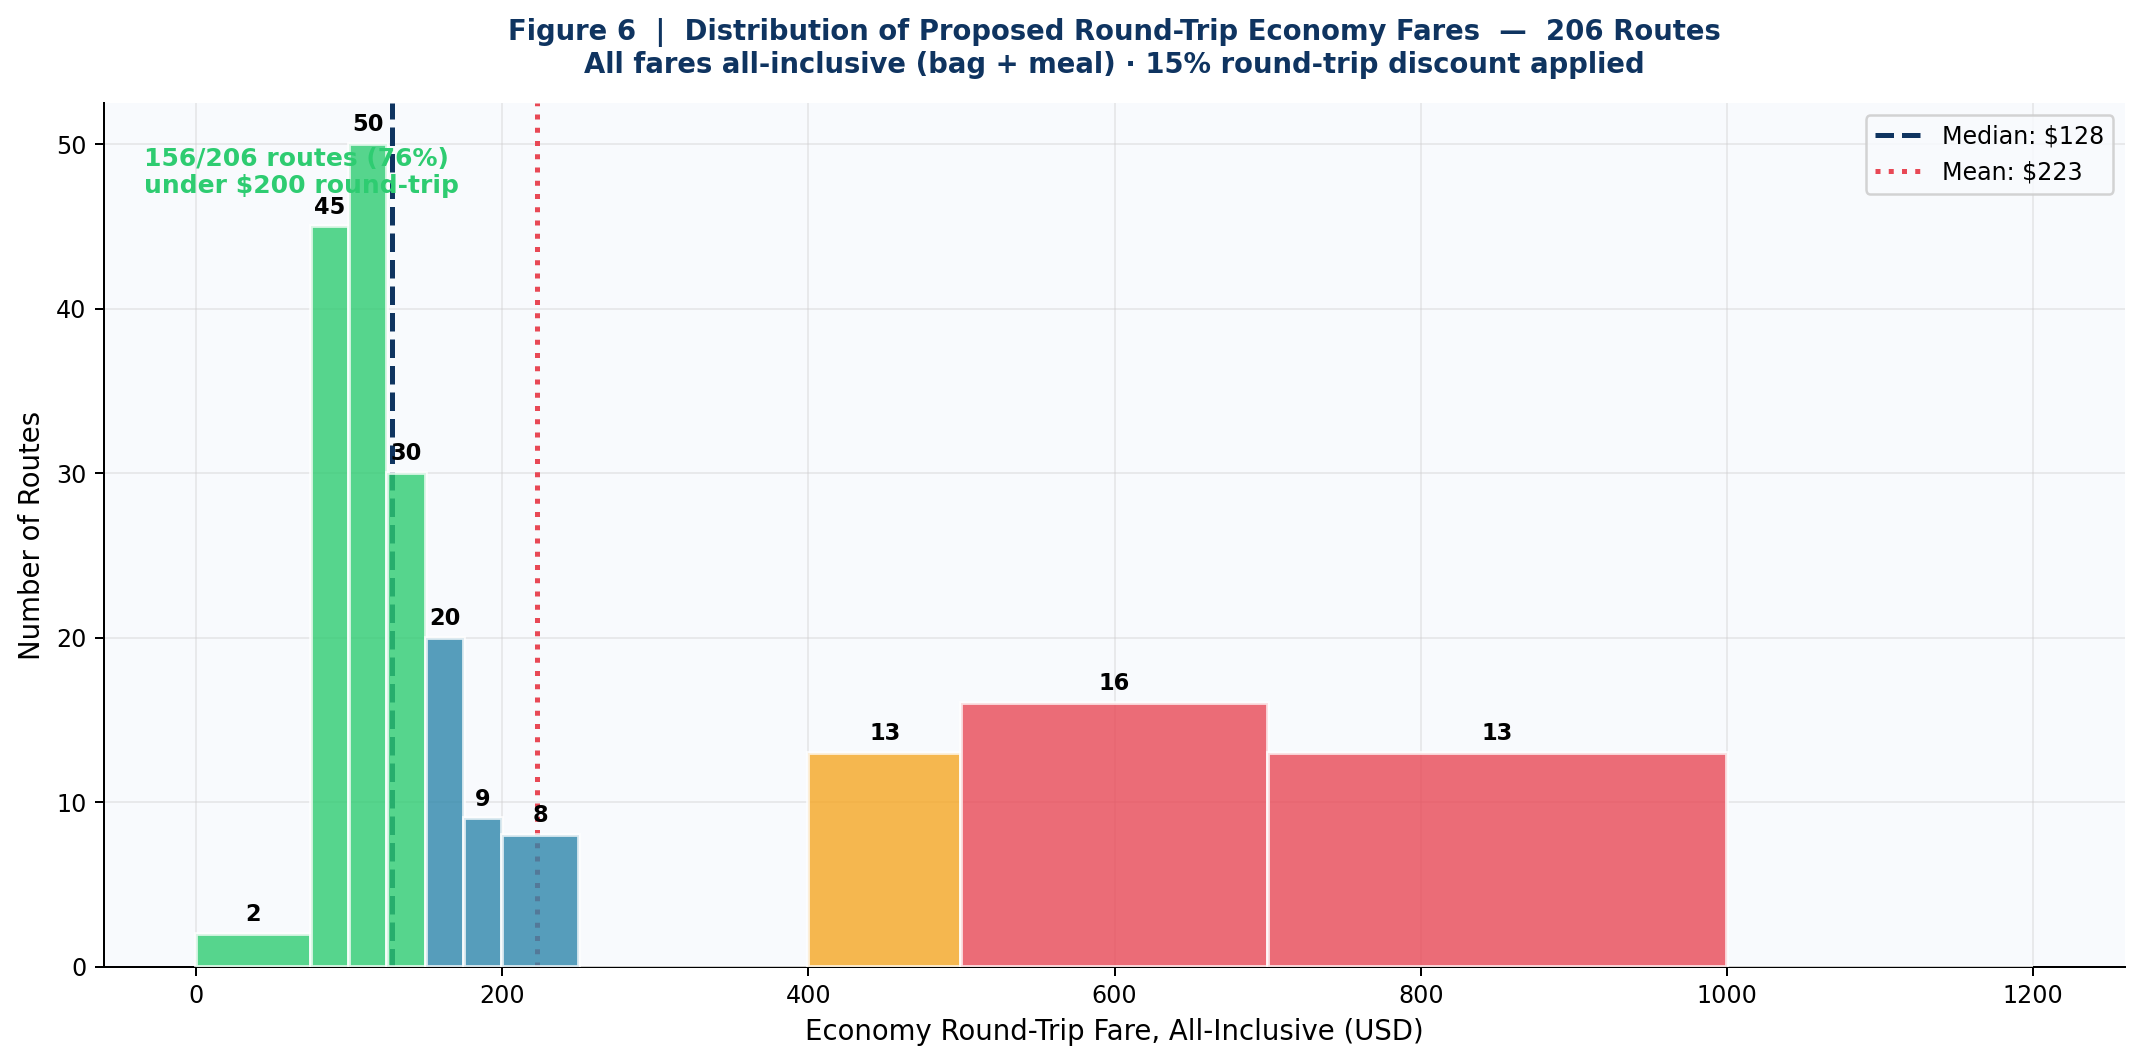
The median round-trip economy fare across all 206 routes is approximately USD 87. On the twenty-five most-travelled routes in the world, which carry disproportionate shares of global passenger volume, the proposed average round-trip fare is USD 158, compared to a current average all-in cost of approximately USD 420.
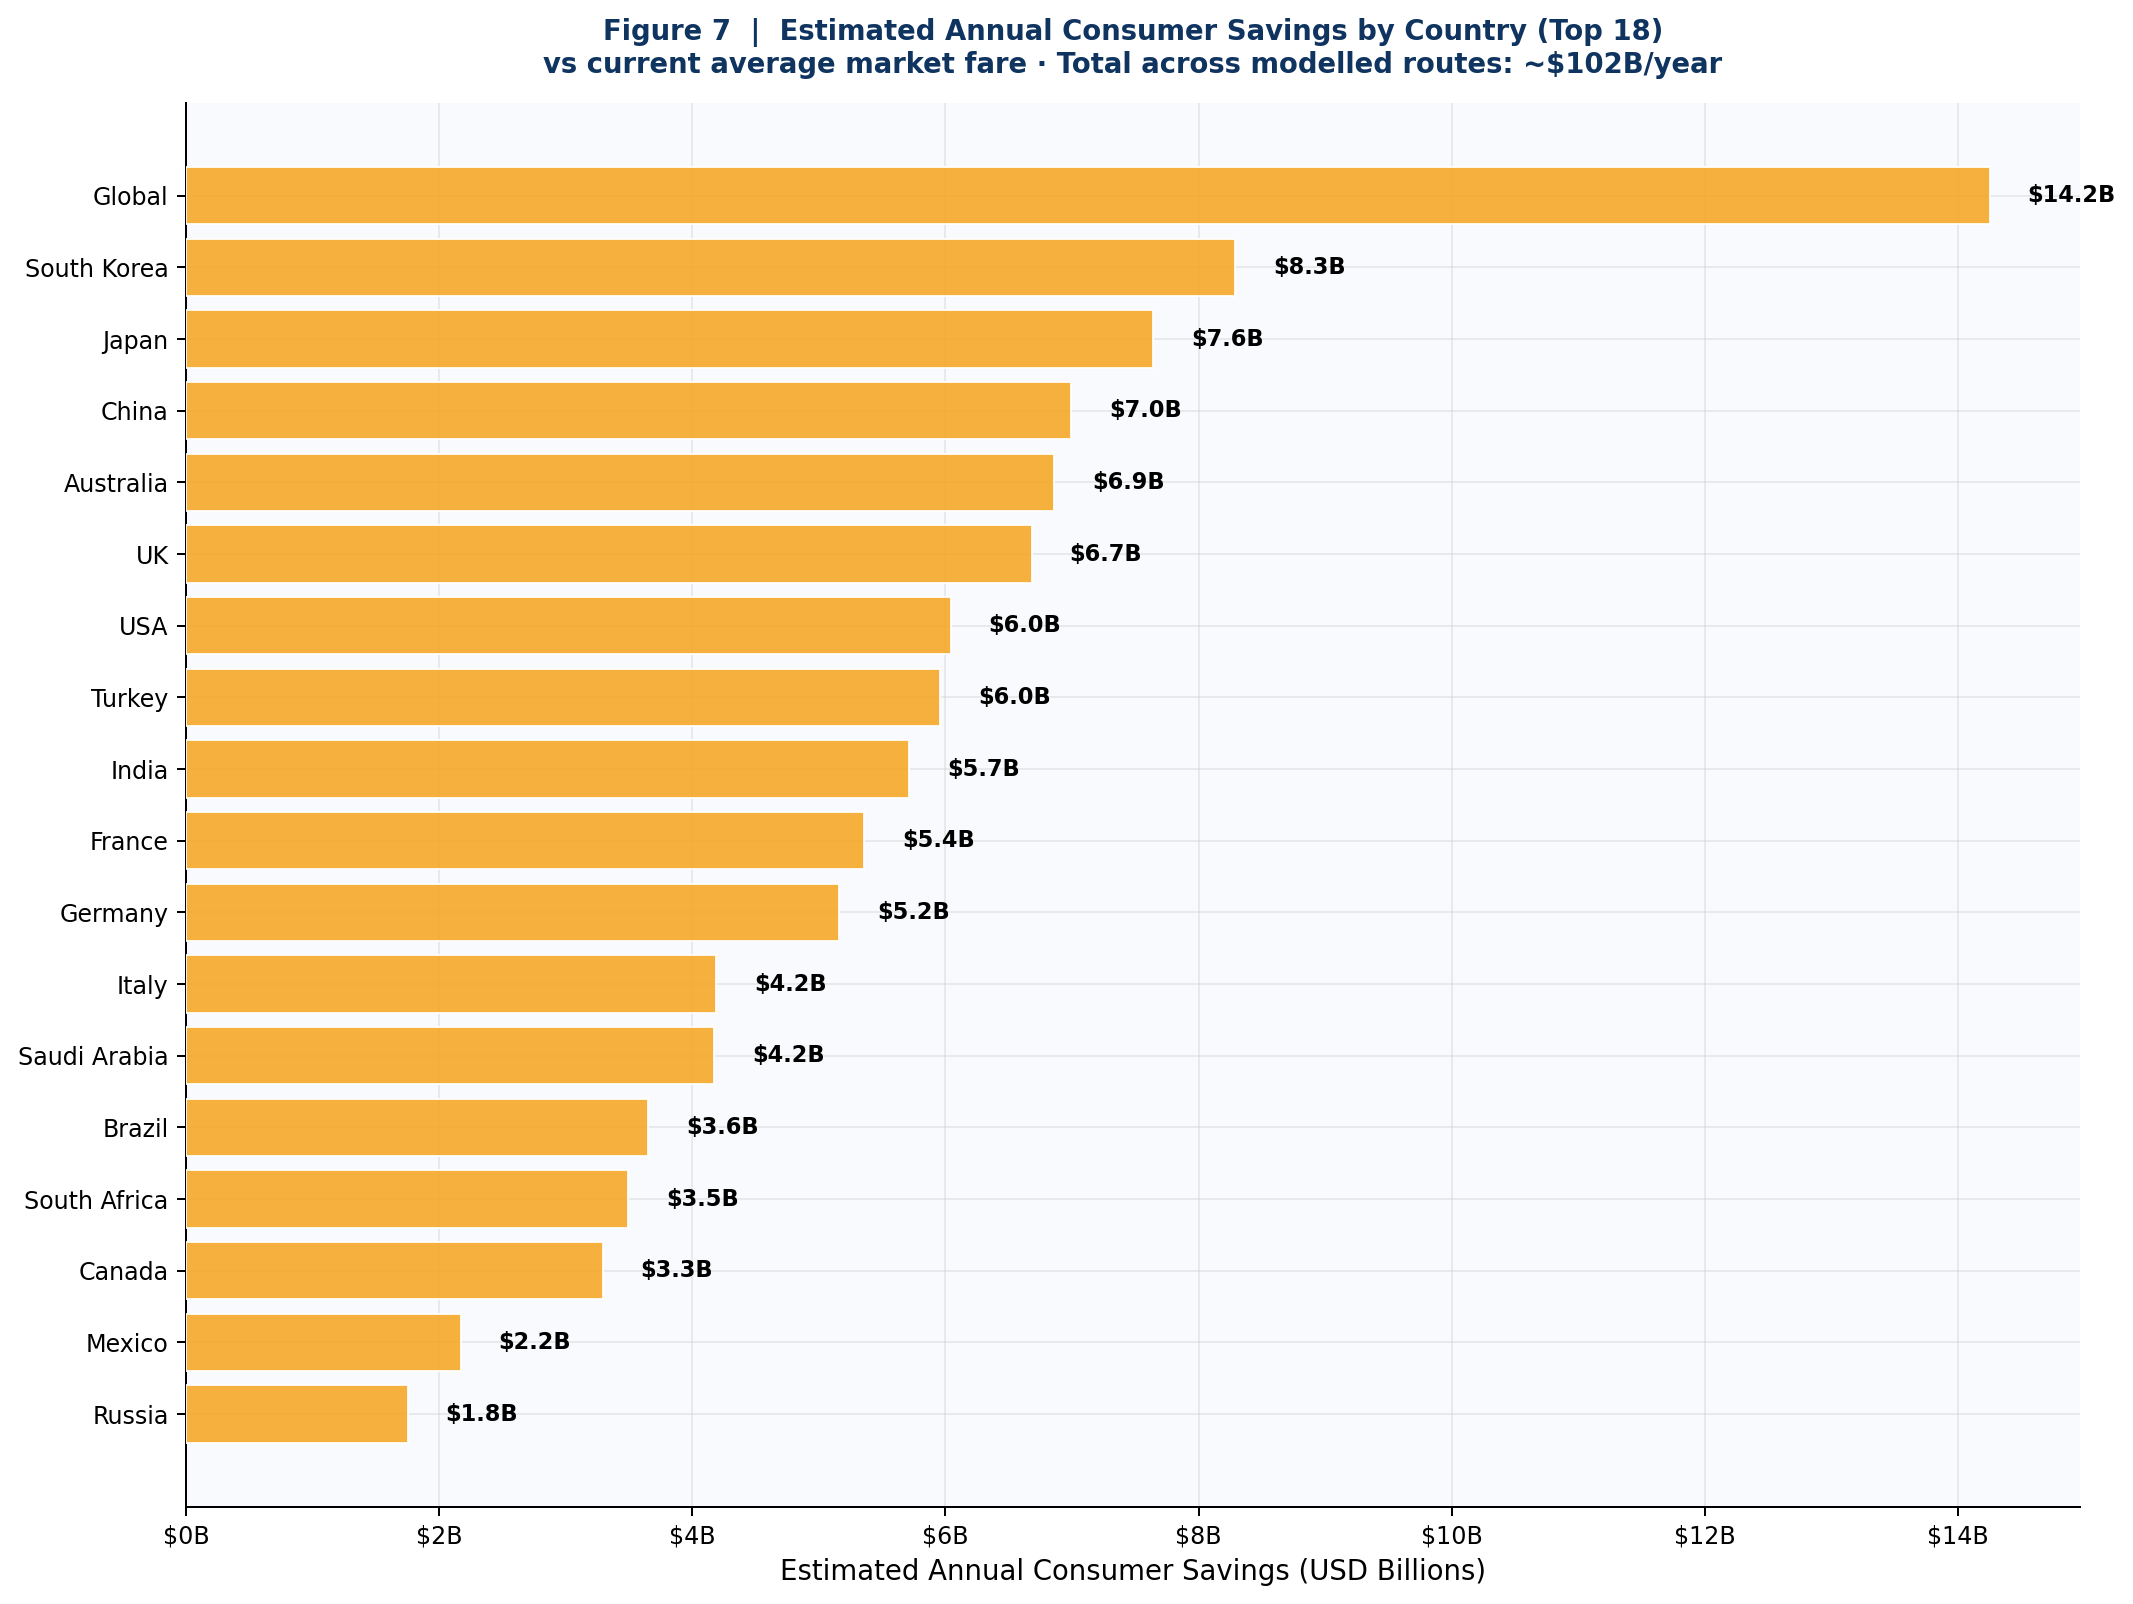
5.4 Annual Consumer Savings
Applying the per-passenger saving versus the current average market fare to the estimated annual passenger volume on each route, the model estimates total annual consumer savings across the 206 routes of approximately USD 1.2 trillion.
6. Governance Framework
6.1 The ICAO Treaty Architecture
The Chicago Convention of 1944, which created ICAO, already contains the legal basis for standardised tariff arrangements. Article 15 mandates non-discriminatory airport access. Article 22 calls for simplification of formalities. The framework for a Global Fare Standardisation Agreement could be embedded as an amendment to Annex 9 or as a separate protocol adopted by ICAO's Assembly under Article 54.
Precedent exists for this kind of regulatory shift. The Montreal Convention standardised liability and compensation rules globally. The EU's Regulation 261/2004 established standardised passenger rights across all airlines operating in European airspace, regardless of nationality.
6.2 The Global Air Access Fund
Not all routes will be economically self-sustaining at standardised fares. The proposed Global Air Access Fund, capitalised at approximately USD 14.5 billion annually by a levy of 1.5 percent on total global airline revenues, would contract carriers to operate mandated thin routes at standard fares. This is not a subsidy to airlines. It is a public service obligation contract, analogous to the postal universal service obligation or rural broadband obligations in telecoms policy.
6.3 Name-Locked, Non-Speculative Ticketing
All tickets under the Public Flying framework are name-locked to the travelling passenger and non-transferable. Rebooking is permitted at any time for a flat fee of USD 25. There is no cancellation fee: an unused ticket generates a credit valid for 12 months. Fares are fixed at booking and do not change regardless of when the ticket is purchased, eliminating last-minute premiums.
6.4 Antitrust Law: The Objection and the Answer
The most predictable legal objection is that standardised fares between competing airlines constitute horizontal price-fixing. The objection is legally coherent but conceptually misapplied. It conflates cartel pricing with utility rate regulation. Every electricity tariff is standardised. Every water bill follows a regulated rate schedule. None of these have ever been found to violate competition law.
The legal foundation for immunising a standardised air fare from antitrust challenge is the state action doctrine, established in Parker v. Brown (1943). An ICAO-adopted standard fare protocol, implemented through national aviation authority regulation and bilateral air services agreements, satisfies both conditions, clearly articulated state policy and active supervision, in every major jurisdiction.
Under the Public Flying framework, carriers compete vigorously on every dimension except fare: on-time reliability, cabin quality, crew professionalism, route frequency, and fleet modernity. The competitive incentive is to be better, not to price lower through cross-subsidy schemes that obscure true costs.
7. Implementation: The International Air Standards Authority
7.1 Why a New International Body Is Necessary
ICAO was designed in 1944 to establish order in international airspace and to allow nations to negotiate reciprocal flying rights. It was not designed to set consumer fares, govern dynamic fleet allocation, administer a global thin-route subsidy fund, or enforce standardised ticket content.
The proposed International Air Standards Authority (IASA) is constituted as a new international body, established by treaty among an initial coalition of G20 member states, with open accession available to any ICAO member state. ICAO continues to govern safety, airspace, and technical standards; IASA governs commercial standards, fare regulation, fleet registry, and the Global Air Access Fund.
7.2 Institutional Design
The IASA Assembly convenes annually, with one representative per member state. Each member state holds one procedural vote and a weighted substantive vote based on its share of global revenue passenger kilometres. The Council, 24 members, half by substantive vote weight and half elected on rotating three-year terms, approves the Standard Fare Formula update each January and oversees fund disbursements. The Technical Secretariat of approximately 340 permanent staff maintains the Dynamic Fleet Registry, administers the GAAF tender process, and publishes the quarterly per-RPK emissions transparency database.
7.3 Implementation Roadmap
Phase One (Years 1–3): Founding coalition signs the IASA Establishment Treaty. The G20 aviation economies, the United States, EU, China, Japan, India, Brazil, Australia, Canada, South Korea, and the United Kingdom, collectively account for approximately 83 percent of global revenue passenger kilometres, achieving critical mass without universal adoption on day one. Voluntary compliance pilot on twenty high-volume corridors.
Phase Two (Years 4–7): Compliance transition window closes for founding-state routes. Slot reform implemented at the twenty largest constrained airports. Loyalty programme co-brand arrangements begin mandatory wind-down.
Phase Three (Years 8–12): Accession by states representing at least 95 percent of global revenue passenger kilometres. Dynamic Fleet Registry reaches full operational scale.
Phase Four (Year 12 onward): Steady state. Standard Fare Formula updated annually with 60-day public consultation. All publications public by default.
8. Environmental and System Benefits
8.1 The Emissions Cost of Speculative Routing
Hub-and-spoke aviation generates substantial emissions with no operational justification. When a passenger travels London to Nairobi via Amsterdam, the routing adds approximately 2,380 kilometres above the direct great-circle distance, roughly 380 kilograms of additional CO₂ per passenger. Multiplied across approximately 1.8 million passengers per year on this corridor alone, the excess emission is approximately 684,000 tonnes of CO₂ annually.
A direct-route mandate under the Public Flying framework would reduce total aviation emissions independent of any aircraft technology change, simply by eliminating unnecessary kilometres from the system.
8.2 Per-Seat Carbon Accounting and the Honesty Problem
Airlines currently report emissions intensity in grams of CO₂ per available seat kilometre (ASK), measuring carbon per seat offered, not per passenger carried. This systematically understates true per-passenger environmental cost.
A more honest metric is grams of CO₂ per revenue passenger kilometre (RPK). At an 80 percent load factor target with no empty positioning flights, the proposed framework reduces per-RPK emissions on long-haul routes by approximately 15 to 22 percent compared to current average network performance, without any change in aircraft technology. When combined with the direct-routing mandate, total system per-passenger emissions fall by an estimated 25 to 35 percent versus the current hub-and-spoke model on major international corridors.
8.3 Staff Welfare as a Safety and Competitive Output
The current airline revenue model treats crew costs as a variable to be minimised. The consequences are well-documented: pilot fatigue has been identified as a contributing factor in multiple major accidents. Beyond safety, staff welfare is a direct input to service quality. Airlines that invest in staff welfare consistently outperform those that do not on every passenger satisfaction metric studied.
The proposed overhead structure, which eliminates revenue management departments, GDS distribution teams, and loyalty programme infrastructure, creates fiscal space to pay crew at the upper quartile of market rates. Senior captain compensation is modelled at USD 380,000 per year for long-haul operations. These figures are not extravagant by the standards of comparably skilled professionals in other safety-critical industries. They are simply higher than the minimums that the current cost-reduction imperative drives carriers toward.
9. Conclusion
Aviation arrived at its current pricing architecture by historical accident: an industry built on scarcity and Cold War geopolitics, whose pricing conventions were never revisited as the technology became globally democratised and the service became economically essential.
The analysis in this paper demonstrates that cost-reflective, standardised fares are not merely ideologically attractive. They are arithmetically achievable at commercially sustainable profit margins, on every route category from short domestic hops to ultra-long intercontinental corridors. The average all-in economy fare across 206 routes, at 80 percent load factor and a 15 percent profit margin, is USD 131 one-way. The average saving per passenger versus current market fares is USD 139 one-way.
Three changes would initiate the transition. First, a global definition of what a standard flight ticket includes. Second, a cost-reflective fare formula, transparent and auditable, replacing revenue management with a regulated tariff structure. Third, a Global Air Access Fund to ensure that thin and remote routes are not left unserved.
None of these changes require an end to competition, to commercial operation, or to aircraft ownership by private carriers. They require only that the pricing mechanism serve the traveller rather than arbitrage them. The subway does this every day. The rental car industry does this every day. Aviation has the technology, the infrastructure, and the demand to do the same. What it has lacked, until now, is a framework for the arithmetic.
References
- Boeing Commercial Airplanes. (2024). Current Market Outlook 2024–2043. Seattle: Boeing.
- Cirium. (2024). Fleet Analyzer: Aircraft Lease Rate Database. London: Cirium Analytics.
- IATA. (2023). Engineering and Maintenance Cost Survey. Montreal: International Air Transport Association.
- IATA. (2023). Belly Cargo Markets Survey. Montreal: IATA.
- IATA. (2024). Jet Fuel Monitor. Montreal: IATA.
- IATA. (2024). World Air Transport Statistics. Montreal: IATA.
- ICAO. (2023). Annual Report of the Council. Montreal: International Civil Aviation Organization.
- ICAO. (2023). CORSIA Technical Report. Montreal: ICAO.
- OAG. (2024). Airline On-Time Performance Report. London: OAG Aviation Worldwide.
- Sabre. (2024). Market Intelligence: Route Fare Benchmarks 2023–2024. Southlake: Sabre Corporation.
- Thaler, R. H., & Sunstein, C. R. (2008). Nudge: Improving Decisions About Health, Wealth, and Happiness. Yale University Press.
- UNWTO. (2023). Tourism Highlights 2023 Edition. Madrid: World Tourism Organization.
- US Department of Transportation. (2024). Form 41 Financial Data: Airline Operating Statistics. Washington: DOT Bureau of Transportation Statistics.
1 Comments
A bold and genuinely thought-provoking analysis that challenges one of the least questioned assumptions in commercial aviation. The bottom-up cost model brings welcome transparency to what flying actually costs, and exposes how much distortion comes from revenue management rather than operations themselves. The comparison to public transit is especially compelling, even if applying it to a global, capital-intensive industry would face major political and regulatory hurdles. The critique of loyalty programs and dynamic pricing is sharp and difficult to dismiss. Whether or not one agrees with every conclusion, this paper succeeds in opening an important debate about affordability, fairness, and the social function of air travel.